Tutorial: Data pipeline editor
CSA Loom
data-pipelineeditor — verified working against a live console by the UAT harness on 2026-07-01.
Open the editor
- Sign in to your CSA Loom Console (for example
https://<your-console-host>). - Open or create a workspace from the Workspaces page.
- Click + New item and choose Data pipeline from the catalog.
- The editor opens at
/items/data-pipeline/<id>:
What this editor does
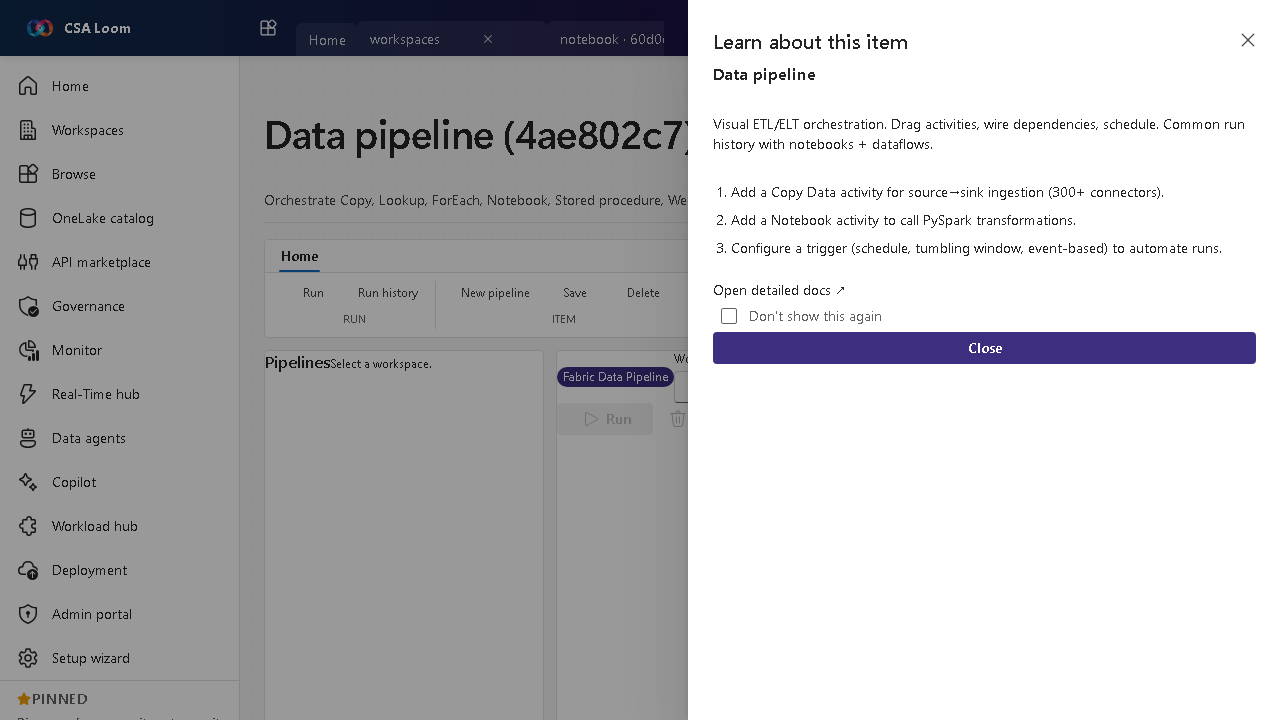
A Data pipeline is visual ETL/ELT orchestration — Copy, Lookup, ForEach, Notebook, Stored procedure, Web and more. Azure-native by default: authored on the standalone Azure Data Factory runtime (or a Synapse workspace), with Microsoft Fabric available as an opt-in runtime. Shares run history with notebooks and dataflows.
Getting started
- Add a Copy activity — Use Copy Data for source-to-sink ingestion across the supported connector set.
- Call a Notebook — Add a Notebook activity to run PySpark transformations inline in the orchestration.
- Wire dependencies — Connect activities with success/failure conditions on the designer canvas to control flow.
- Publish, then Debug — Publish deploys the pipeline to Azure Data Factory so it can run. Debug dispatches a run and streams its receipts back onto the canvas: each activity node paints its live run status, the run strip shows overall progress with Rerun from failed, and the eyeglass on a node opens the run's input / output / error JSON.
- Schedule a trigger — Configure a schedule, tumbling window, or event-based trigger to automate runs and review run history.
Learn more
- Microsoft Learn reference: https://learn.microsoft.com/azure/data-factory/introduction
Verified by the UAT harness
- Tested at:
2026-05-26T13:50:45.325Z - Verdict: A (renders cleanly, real backend responded)
- Test source:
apps/fiab-console/e2e/editors.uat.ts
Debug runs on the canvas
Home → Run has three actions in order: Publish (deploy the pipeline to Azure Data Factory), Run (queue a real trigger run), and Debug (dispatch a debug run). All three are enabled as soon as a pipeline is selected or created. You do not have to remember to publish: if Run or Debug hits a pipeline with no ADF backing yet, the editor toasts "Publishing to ADF first…", publishes, and retries the dispatch once.
Run queues the trigger run and switches to the Output tab. Debug keeps you on the canvas and streams its receipts onto it, not only into a table:
- Per-activity status on the node. Each activity node's status chip switches to that activity's run status — queued / running / succeeded / failed / skipped / cancelled — with a detail line:
Running…while it is in flight, the error code when it fails, and the elapsed duration once it finishes. - The run strip. A compact banner over the canvas shows a short run id, the derived overall status, an
N/M activitiesprogress count, and a spinner while the poller is still streaming. If the run ends Failed, the strip offers Rerun from failed — a real ADF recovery run (isRecovery+startFromFailure) against the same run id. Dismiss clears the overlay. - The eyeglass. Hover or select a node that has a receipt and its action bar leads with View run details, which opens that activity's status, duration, and the input / output / error JSON the ADF
queryActivityRunsAPI returned. Where the host wires it, the dialog also offers Rerun from this activity (isRecovery+startActivityName).
Both pipeline canvases carry this — the data-pipeline editor's own canvas and the shared PipelineDesigner used by the other pipeline-hosting editors.
The Output dock
Output → Show output dock docks the Output pane (Monitor + Debug run tables over the same queryPipelineRuns / queryActivityRuns calls) directly under the graph, so a run's receipts and the canvas are visible together. A Debug dispatch opens it automatically instead of navigating away to the Output tab and hiding the graph.
The dock's height is drag-resizable (pointer or keyboard) and the size persists per user under loom.canvasHeight.data-pipeline-output-dock. Output → Open Output tab still switches to the full-page Output view, and Pin output keeps it open across runs.
One run path
The canvas overlay does not run anything itself. The existing surfaces — the ribbon Debug dispatch, the Debug run panel's poller, and the Monitor drill-down — publish the rows they already fetched from the /output and /runs BFF routes into a small store keyed by the pipeline item id, and the canvas subscribes to it. There is exactly one run path and one set of ADF / Synapse calls behind everything above.
Kill-switch
The on-canvas paint is behind the default-ON runtime flag u13-pipeline-run-overlay (Admin → Runtime flags). Turning it OFF reverts both canvases to the pre-U13 glyph-less rendering on the next render. The Output pane, the Debug dispatch, recovery reruns, and every /output and /runs route keep working — only the canvas paint is gated.
No Fabric required
The default runtime is a standalone Azure Data Factory (Synapse is the other Azure-native option). Fabric is selectable at create time as an opt-in runtime and is never required for a pipeline to author, publish, debug, run, or schedule.