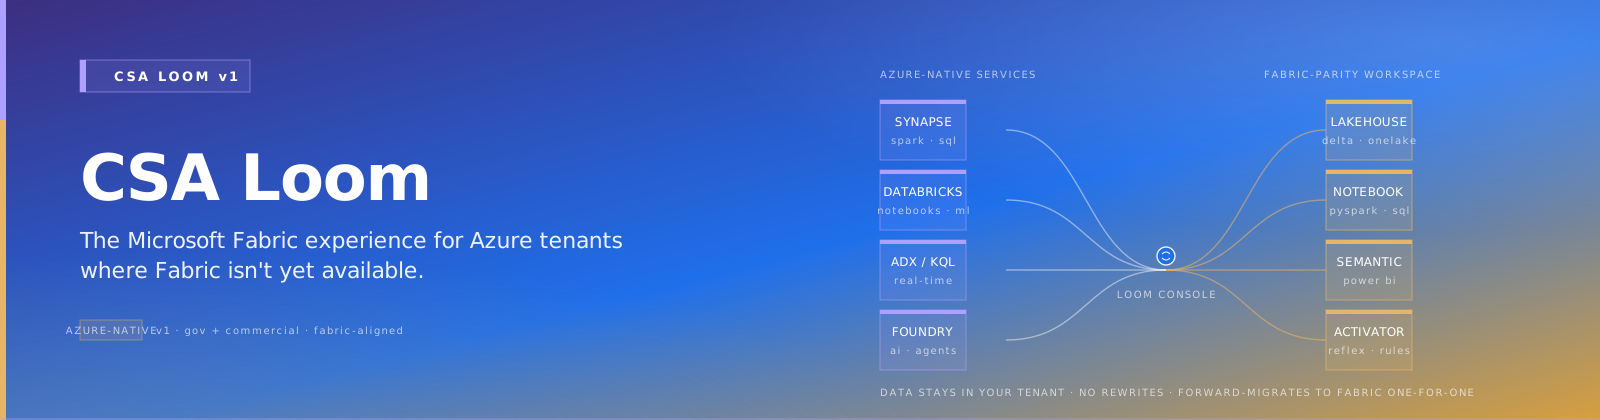
Tutorial: Dashboard editor
CSA Loom
dashboardeditor — verified working against a live console by the UAT harness on 2026-07-01.
Open the editor
- Sign in to your CSA Loom Console (for example
https://<your-console-host>). - Open or create a workspace from the Workspaces page.
- Click + New item and choose Dashboard from the catalog.
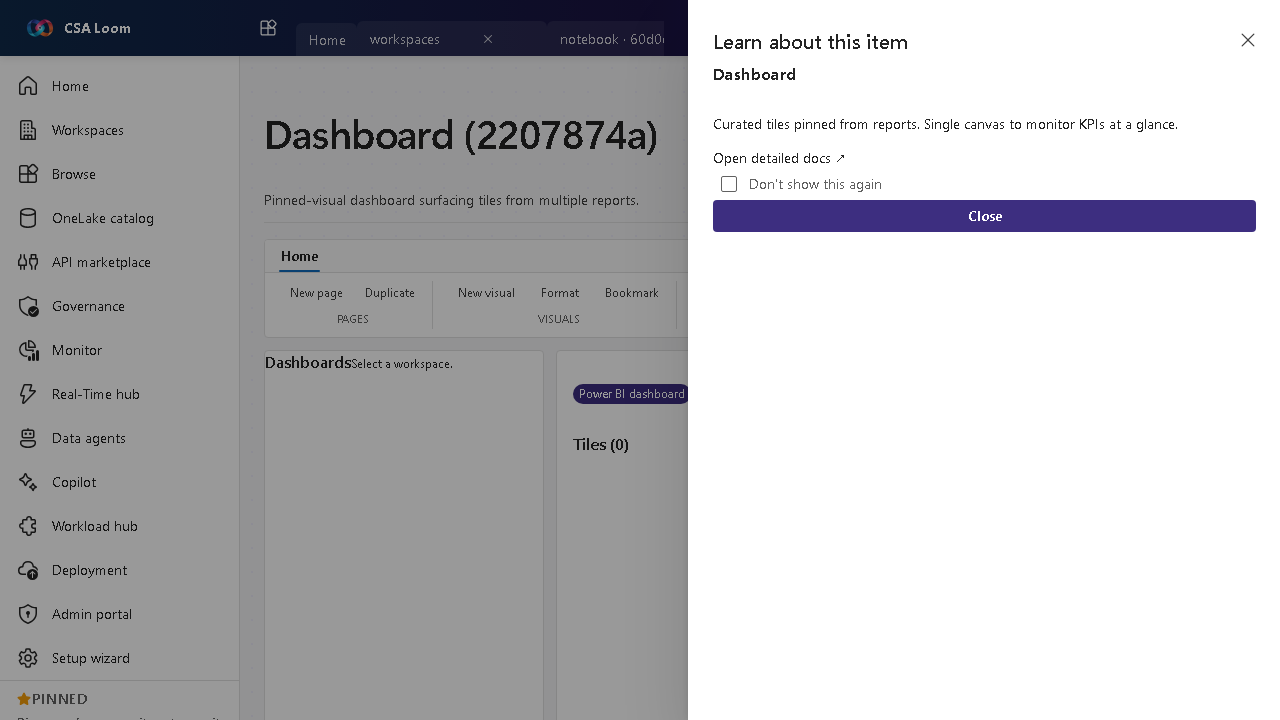
- The editor opens at
/items/dashboard/<id>:
What this editor does
A Dashboard is a pinned-visual canvas surfacing tiles from multiple reports. In Loom it is wired against live Power BI REST via the Console UAMI. Use it to monitor KPIs at a glance across reports.
Getting started
- Pin tiles — Pin visuals from one or more reports onto the dashboard canvas.
- Arrange the layout — Size and position tiles so the most important KPIs read first.
- Embed and view — Loom embeds the dashboard for in-console monitoring.
- Mind tenant gating — If the Console UAMI isn't yet registered in the Power BI tenant or workspace, the editor surfaces the 401/403 with a remediation hint.
Learn more
- Microsoft Learn reference: https://learn.microsoft.com/power-bi/create-reports/service-dashboards
Verified by the UAT harness
- Tested at:
2026-05-26T13:51:57.206Z - Verdict: A (renders cleanly, real backend responded)
- Test source:
apps/fiab-console/e2e/editors.uat.ts