⚡ Tutorial 04: Real-Time Analytics
Last Updated: 2026-04-15 | Version: 2.0 Status: ✅ Final | Maintainer: Documentation Team



⚡ Tutorial 04: Real-Time Analytics - Live Floor Monitoring
| Attribute | Details |
|---|---|
| Difficulty | ⭐⭐ Intermediate |
| Time Estimate | ⏱️ 60-75 minutes |
| Focus Area | Real-Time Intelligence |
| Key Skills | Eventhouse, Eventstreams, KQL, Real-Time Dashboards |
📊 Progress Tracker
┌────────┬────────┬────────┬────────┬────────┬────────┬────────┬────────┬────────┬────────┐
│   00   │   01   │   02   │   03   │   04   │   05   │   06   │   07   │   08   │   09   │
│ SETUP  │ BRONZE │ SILVER │  GOLD  │   RT   │  PBI   │ PIPES  │  GOV   │ MIRROR │  AI/ML │
├────────┼────────┼────────┼────────┼────────┼────────┼────────┼────────┼────────┼────────┤
│   ✓    │   ✓    │   ✓    │   ✓    │  ⚡    │   ○    │   ○    │   ○    │   ○    │   ○    │
└────────┴────────┴────────┴────────┴────────┴────────┴────────┴────────┴────────┴────────┘
                                        ▲
                                        │
                                   YOU ARE HERE
| Navigation | Link |
|---|---|
| ⬅️ Previous | 03-Gold Layer |
| ➡️ Next | 05-Direct Lake & Power BI |
📸 Note: This tutorial contains screenshot placeholders with detailed descriptions of what should be captured. When running through this tutorial in your environment, we encourage you to capture your own screenshots at the indicated locations to document your specific implementation.
📋 Overview
This tutorial covers implementing real-time analytics for casino floor monitoring using Fabric Real-Time Intelligence. You will create streaming pipelines that process slot machine events in near real-time, enabling instant visibility into floor operations, jackpots, and machine performance.
💡 Why Real-Time Analytics?
Casino operations require immediate awareness of floor activity for: - Jackpot verification - Instant notification when hand pays are needed - Floor optimization - Identify hot/cold zones in real-time - Security monitoring - Detect unusual patterns immediately - Compliance - Track large transactions as they happen
📊 Visual Overview
The following sequence diagram illustrates the real-time event flow from slot machines through Eventstream, Eventhouse, KQL queries, to live dashboards for instant casino floor monitoring.
%%{init: {'theme':'base', 'themeVariables': {'primaryColor':'#FF6B35','primaryTextColor':'#fff','primaryBorderColor':'#C53030','lineColor':'#E85D04','secondaryColor':'#FFF3E0','tertiaryColor':'#fff'}}}%%
sequenceDiagram
    participant SLOT as 🎰 Slot Machine<br/>(IoT Device)
    participant IOT as 📡 IoT Hub / Event Hub<br/>(Ingestion)
    participant ES as ⚡ Eventstream<br/>(Stream Processing)
    participant EH as 🏠 Eventhouse<br/>(KQL Database)
    participant KQL as 📊 KQL Query<br/>(Analytics)
    participant DASH as 🖥️ Real-Time Dashboard<br/>(Power BI)
    participant ALERT as 🔔 Activator<br/>(Alerts)

    Note over SLOT,ALERT: Real-Time Event Flow (< 1 second latency)

    %% Event Generation
    SLOT->>SLOT: Player spins<br/>Win: $2,500 (Jackpot!)
    activate SLOT

    SLOT->>IOT: Publish event<br/>JSON payload
    deactivate SLOT
    activate IOT

    Note over IOT: Event buffered<br/>< 100ms

    %% Eventstream Processing
    IOT->>ES: Stream events<br/>(continuous)
    deactivate IOT
    activate ES

    ES->>ES: Transform & Filter<br/>- Parse JSON<br/>- Enrich with metadata<br/>- Route by event type

    Note over ES: Streaming transformations:<br/>• Add timestamp<br/>• Calculate win amount<br/>• Classify event severity

    ES->>EH: Ingest to table<br/>(slot_events_rt)
    deactivate ES
    activate EH

    Note over EH: Hot cache (in-memory)<br/>Last 24 hours

    %% KQL Processing
    EH->>KQL: Auto-refresh query<br/>(every 10 seconds)
    activate KQL

    Note over KQL: KQL Query Example:<br/>slot_events_rt<br/>| where win_amount > 1200<br/>| summarize by machine_id

    KQL-->>EH: Aggregated results
    deactivate KQL

    %% Dashboard Update
    EH->>DASH: Push updated data
    activate DASH

    DASH->>DASH: Refresh visuals<br/>- Floor heat map<br/>- Jackpot ticker<br/>- Performance KPIs

    Note over DASH: Auto-refresh<br/>every 10 seconds

    DASH-->>DASH: 🎉 Display jackpot<br/>alert on floor map
    deactivate DASH

    %% Alert Processing
    par Parallel Alert Processing
        EH->>ALERT: Trigger condition met<br/>(win_amount > $1,200)
        activate ALERT

        ALERT->>ALERT: Evaluate rules<br/>Hand pay required

        ALERT->>ALERT: 📧 Send notification<br/>to floor manager

        ALERT->>ALERT: 💾 Log alert event
        deactivate ALERT
    end

    Note over SLOT,ALERT: End-to-end latency: 500ms - 2 seconds

    rect rgb(255, 107, 53, 0.1)
        Note right of DASH: Real-Time Benefits:<br/>✓ Instant jackpot alerts<br/>✓ Live floor monitoring<br/>✓ Immediate anomaly detection<br/>✓ Sub-second latency
    end

    %% Continuous Loop
    loop Every 100ms (High-Volume Events)
        SLOT->>IOT: Continuous telemetry<br/>(spins, bets, outcomes)
        IOT->>ES: Stream batch
        ES->>EH: Bulk ingest
    end
Key Components:
- Event Generation: Slot machines emit events (spins, wins, errors) in real-time
- Eventstream: Ingests, transforms, and routes events with low latency (< 100ms)
- Eventhouse: High-performance KQL database optimized for time-series analytics
- KQL Queries: Lightning-fast analytical queries with automatic caching
- Real-Time Dashboard: Auto-refreshing Power BI dashboard (10-second refresh)
- Activator Alerts: Intelligent alerting for critical events (jackpots, errors)
Performance Characteristics: - Ingestion Rate: 100,000+ events/second per Eventstream - End-to-End Latency: 500ms - 2 seconds from event to dashboard - Query Performance: Sub-second response for billions of events - Hot Cache: Last 24 hours in-memory for instant queries - Auto-Refresh: Configurable dashboard refresh (default: 10 seconds)
Casino Use Cases: - 🎰 Jackpot Monitoring: Instant alerts when hand pays are required ($1,200+) - 📍 Floor Heat Maps: Live visualization of hot/cold machine zones - 🚨 Anomaly Detection: Detect unusual win patterns or machine errors - 💰 Compliance Tracking: Real-time monitoring of large transactions (CTR/SAR) - 📊 Performance Metrics: Live coin-in, hold percentage, player count
🎯 Learning Objectives
By the end of this tutorial, you will be able to:
- Create an Eventhouse with KQL database for streaming data
- Configure Eventstreams for real-time data ingestion
- Write KQL queries for casino floor monitoring
- Build auto-refreshing real-time dashboards
- Set up alerts for critical events (jackpots, anomalies)
🏗️ Real-Time Intelligence Architecture

Source: What is Real-Time Intelligence in Microsoft Fabric?
flowchart LR
    subgraph Sources["📡 Data Sources"]
        SL[Slot Machines]
        TM[Table Games]
        POS[POS Systems]
    end

    subgraph Eventstream["⚡ Eventstream"]
        ES[Event Ingestion]
        TR[Transform & Route]
    end

    subgraph Eventhouse["🏠 Eventhouse"]
        KQL[(KQL Database)]
        AGG[Real-Time Aggregations]
    end

    subgraph Output["📊 Outputs"]
        DASH[Real-Time Dashboard]
        ALERT[Alerts]
        API[Query API]
    end

    Sources --> Eventstream
    ES --> TR
    TR --> KQL
    KQL --> AGG
    AGG --> DASH
    AGG --> ALERT
    KQL --> API

    style Sources fill:#e1f5fe
    style Eventstream fill:#fff3e0
    style Eventhouse fill:#e8f5e9
style Output fill:#fce4ec | Component | Purpose |
|---|---|
| Eventstream | Ingests and routes streaming data from multiple sources |
| Eventhouse | High-performance analytics store with KQL database |
| KQL Database | Stores time-series data optimized for analytics queries |
| Real-Time Dashboard | Auto-refreshing visualizations of live data |
📋 Prerequisites
Before starting this tutorial, ensure you have:
- ✅ Completed Tutorial 03: Gold Layer
- ✅ Access to Fabric workspace with Real-Time Intelligence capacity
- ✅ Understanding of basic SQL concepts
- ✅ (Optional) Azure Event Hub or sample data source
⚠️ Capacity Requirements
Real-Time Intelligence requires F2 or higher Fabric capacity. If using a trial, ensure Real-Time Intelligence is enabled in your workspace settings.
🛠️ Step 1: Create Eventhouse
An Eventhouse is a high-performance analytics store optimized for streaming and time-series data.
1.1 Create Eventhouse in Fabric Portal
- Open your workspace (
casino-fabric-poc) - Click + New > Eventhouse
- Configure the Eventhouse:
| Setting | Value | Description |
|---|---|---|
| Name | eh_casino_realtime | Descriptive name for the Eventhouse |
| OneLake availability | ✅ Enabled | Allows data to be queried via OneLake |
- Click Create
💡 Tip: OneLake Availability
Enabling OneLake availability allows your real-time data to be accessible via Spark notebooks and other Fabric services, enabling hybrid batch/real-time analytics.
1.2 Create KQL Database
After the Eventhouse is created:
- Click on the Eventhouse to open it
- Click + New database
- Configure:
| Setting | Value |
|---|---|
| Database name | casino_floor_monitoring |
| Retention period | 365 days (default) |
| Cache period | 31 days (default) |
- Click Create
ℹ️ Retention vs. Cache
- Retention period: How long data is kept before automatic deletion
- Cache period: How much recent data is kept in hot storage for fastest queries
🛠️ Step 2: Define KQL Tables
2.1 Open KQL Query Editor
- Click on your database (
casino_floor_monitoring) - Click Explore your data or Query to open the KQL editor
2.2 Create Slot Events Table
This is the primary table for streaming slot machine telemetry.
// Create table for real-time slot events
.create table SlotEvents (
    event_id: string,
    machine_id: string,
    zone: string,
    event_type: string,
    event_timestamp: datetime,
    coin_in: real,
    coin_out: real,
    jackpot_amount: real,
    player_id: string,
    denomination: real,
    ingestion_time: datetime
)
2.3 Create Ingestion Mapping
Create a JSON mapping for the Eventstream to map incoming data to table columns.
// Create mapping for JSON ingestion
.create table SlotEvents ingestion json mapping 'SlotEventsMapping'
'['
'    {"column": "event_id", "path": "$.event_id", "datatype": "string"},'
'    {"column": "machine_id", "path": "$.machine_id", "datatype": "string"},'
'    {"column": "zone", "path": "$.zone", "datatype": "string"},'
'    {"column": "event_type", "path": "$.event_type", "datatype": "string"},'
'    {"column": "event_timestamp", "path": "$.event_timestamp", "datatype": "datetime"},'
'    {"column": "coin_in", "path": "$.coin_in", "datatype": "real"},'
'    {"column": "coin_out", "path": "$.coin_out", "datatype": "real"},'
'    {"column": "jackpot_amount", "path": "$.jackpot_amount", "datatype": "real"},'
'    {"column": "player_id", "path": "$.player_id", "datatype": "string"},'
'    {"column": "denomination", "path": "$.denomination", "datatype": "real"},'
'    {"column": "ingestion_time", "path": "$.ingestion_time", "datatype": "datetime"}'
']'
2.4 Create Security Events Table
For tracking security incidents in real-time.
// Create table for security events
.create table SecurityEvents (
    event_id: string,
    event_type: string,
    event_timestamp: datetime,
    zone: string,
    severity: string,
    description: string,
    responding_officer: string,
    resolution_status: string
)

// Create ingestion mapping
.create table SecurityEvents ingestion json mapping 'SecurityEventsMapping'
'['
'    {"column": "event_id", "path": "$.event_id"},'
'    {"column": "event_type", "path": "$.event_type"},'
'    {"column": "event_timestamp", "path": "$.event_timestamp"},'
'    {"column": "zone", "path": "$.zone"},'
'    {"column": "severity", "path": "$.severity"},'
'    {"column": "description", "path": "$.description"},'
'    {"column": "responding_officer", "path": "$.responding_officer"},'
'    {"column": "resolution_status", "path": "$.resolution_status"}'
']'
2.5 Create Floor Activity Summary Table
Pre-aggregated data for dashboard performance.
// Create table for aggregated floor activity
.create table FloorActivity (
    timestamp: datetime,
    zone: string,
    active_machines: int,
    active_players: int,
    coin_in_rate: real,
    jackpot_count: int
)
💡 Best Practice: Pre-Aggregation
For high-volume streaming data, create update policies to automatically aggregate data into summary tables. This dramatically improves dashboard query performance.
🛠️ Step 3: Configure Eventstream
An Eventstream captures, transforms, and routes streaming data to destinations.
3.1 Create Eventstream
- In your workspace, click + New > Eventstream
- Name:
es_slot_telemetry - Click Create
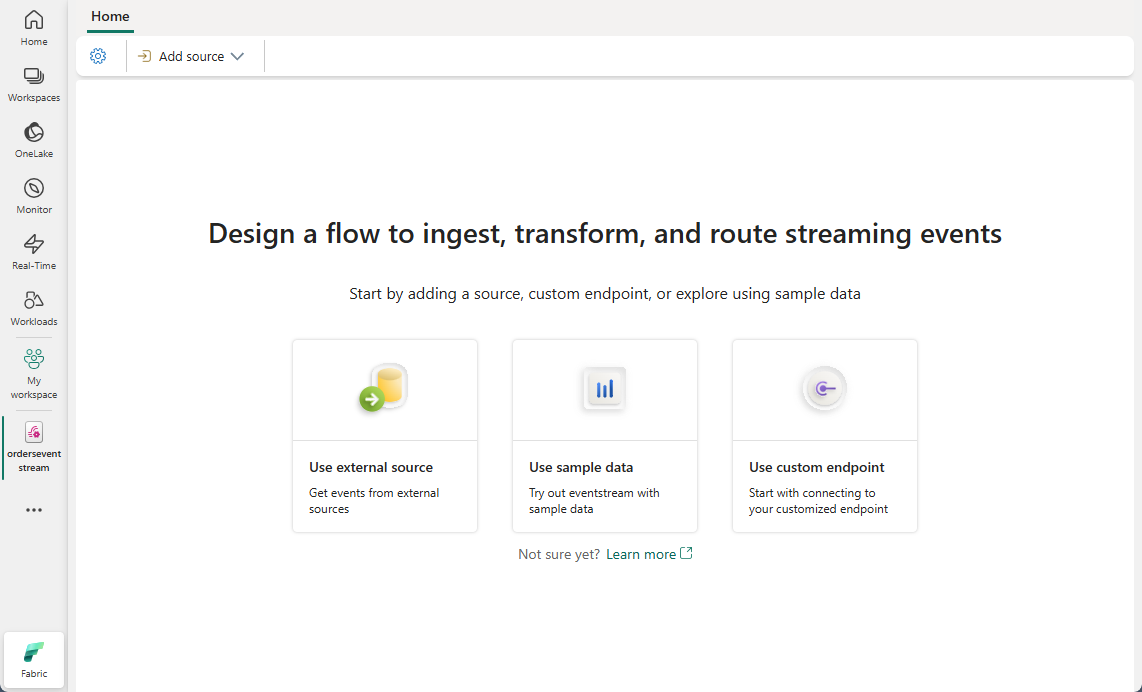
The Eventstream editor canvas where you add sources and destinations. Source: Create and manage an eventstream
3.2 Add Data Source
Choose the appropriate source for your scenario:
Option A: Azure Event Hub (Production)
For production environments connecting to real slot systems:
- Click Add source > External sources > Azure Event Hubs
- Configure:
| Setting | Value |
|---|---|
| Connection | Create new or select existing |
| Event Hub namespace | Your Event Hub namespace |
| Event Hub | Your Event Hub name |
| Consumer group | $Default or dedicated group |
| Data format | JSON |
- Click Add
Option B: Custom App (Development/Testing)
For testing with simulated data:
- Click Add source > Custom app
- Copy the Connection string - you'll need this for the Python producer (Step 6)
- Click Add
⚠️ Important
Store the connection string securely. Never commit it to source control.
3.3 Add Transformation (Optional)
Add a transformation to enrich or filter events:
- Click Add transformation > Manage fields
- Configure:
- Add computed column:
processing_time = now() - Filter:
event_type != 'HEARTBEAT'(exclude heartbeat events)
3.4 Add Eventhouse Destination
- Click Add destination > Eventhouse
- Configure:
| Setting | Value |
|---|---|
| Eventhouse | eh_casino_realtime |
| Database | casino_floor_monitoring |
| Table | SlotEvents |
| Input data format | JSON |
| Ingestion mapping | SlotEventsMapping |
- Click Add
3.5 Activate Eventstream
- Review the data flow diagram - verify source, transformation, and destination are connected
- Click Publish to activate the stream
flowchart LR
    A[📡 Source<br/>Event Hub/Custom App] --> B[🔄 Transform<br/>Add Fields/Filter]
    B --> C[🏠 Destination<br/>Eventhouse]

    style A fill:#e3f2fd
    style B fill:#fff8e1
    style C fill:#e8f5e9
🛠️ Step 4: KQL Queries for Monitoring
Now write KQL queries to analyze the streaming data.
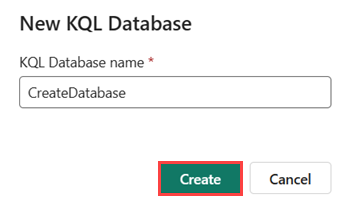
Create a new KQL database to store streaming data. Source: Create a KQL database

The attached KQL queryset for running queries against your data. Source: Create a KQL database
4.1 Real-Time Slot Activity by Zone
// Last 5 minutes of slot activity by zone
SlotEvents
| where event_timestamp > ago(5m)
| where event_type == "GAME_PLAY"
| summarize
    total_games = count(),
    total_coin_in = sum(coin_in),
    total_coin_out = sum(coin_out),
    unique_players = dcount(player_id),
    active_machines = dcount(machine_id)
by zone
| extend net_win = total_coin_in - total_coin_out
| extend hold_pct = round((net_win / total_coin_in) * 100, 2)
| order by total_coin_in desc
4.2 Jackpot Alerts (Real-Time)
// Recent jackpots (last 15 minutes) - for floor alerts
SlotEvents
| where event_timestamp > ago(15m)
| where event_type in ("JACKPOT", "HAND_PAY")
| where jackpot_amount > 0
| project
    event_timestamp,
    machine_id,
    zone,
    jackpot_amount,
    player_id,
    time_ago = datetime_diff('minute', now(), event_timestamp)
| extend alert_level = case(
    jackpot_amount >= 10000, "🔴 HIGH",
    jackpot_amount >= 5000, "🟡 MEDIUM",
    "🟢 NORMAL"
)
| order by event_timestamp desc
| take 20
4.3 Machine Performance Trends
// Hourly slot performance trend (last 24 hours)
SlotEvents
| where event_timestamp > ago(24h)
| where event_type == "GAME_PLAY"
| summarize
    total_coin_in = sum(coin_in),
    total_coin_out = sum(coin_out),
    games = count()
by bin(event_timestamp, 1h), zone
| extend hold_rate = round((total_coin_in - total_coin_out) / total_coin_in * 100, 2)
| render timechart
4.4 Hot/Cold Machine Detection
// Machines with unusual hold rates (last hour)
// Use for identifying machines needing attention
SlotEvents
| where event_timestamp > ago(1h)
| where event_type == "GAME_PLAY"
| summarize
    coin_in = sum(coin_in),
    coin_out = sum(coin_out),
    games = count()
by machine_id, zone
| where coin_in > 100  // Minimum activity threshold
| extend hold_pct = round((coin_in - coin_out) / coin_in * 100, 2)
| extend machine_status = case(
    hold_pct > 15, "🔥 HOT - High Hold",
    hold_pct < -5, "❄️ COLD - Paying Out",
    "✅ NORMAL"
)
| where machine_status != "✅ NORMAL"
| order by hold_pct desc
4.5 Floor Heatmap Data
// Zone activity scores for heatmap visualization
SlotEvents
| where event_timestamp > ago(30m)
| summarize
    activity_score = count(),
    coin_in = sum(coin_in),
    players = dcount(player_id),
    machines = dcount(machine_id)
by zone
| extend activity_level = case(
    activity_score > 1000, "🔴 Very High",
    activity_score > 500, "🟠 High",
    activity_score > 100, "🟡 Medium",
    "🟢 Low"
)
| extend coin_in_formatted = format_number(coin_in, "C")
| order by activity_score desc
4.6 Player Session Tracking
// Active player sessions (last 30 minutes)
SlotEvents
| where event_timestamp > ago(30m)
| where isnotempty(player_id)
| summarize
    session_start = min(event_timestamp),
    session_end = max(event_timestamp),
    total_coin_in = sum(coin_in),
    total_coin_out = sum(coin_out),
    games_played = count(),
    machines_used = dcount(machine_id)
by player_id
| extend
    session_duration_min = datetime_diff('minute', session_end, session_start),
    net_result = total_coin_out - total_coin_in
| order by total_coin_in desc
| take 50
💡 Query Performance Tips
- Always include a time filter (
where event_timestamp > ago(...))- Use
take Nduring development to limit results- Pre-aggregate data for dashboard queries
- Use
dcount()sparingly on high-cardinality columns
🛠️ Step 5: Create Real-Time Dashboard
5.1 Create Dashboard
- In your workspace, click + New > Real-Time Dashboard
- Name:
Casino Floor Monitor - Click Create
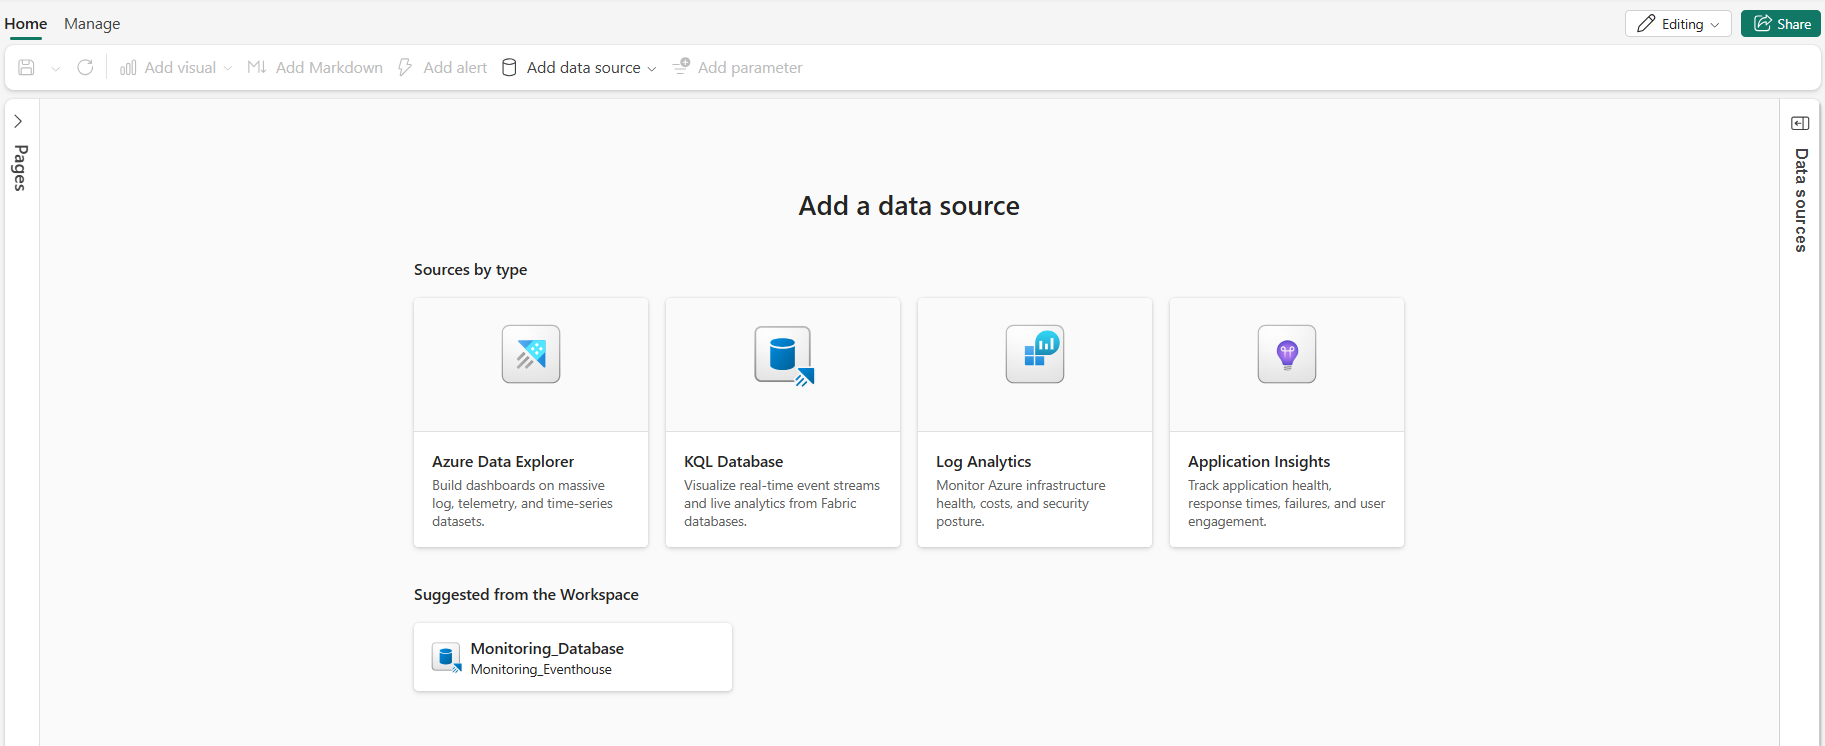
A newly created Real-Time Dashboard ready for configuration. Source: Create a Real-Time Dashboard
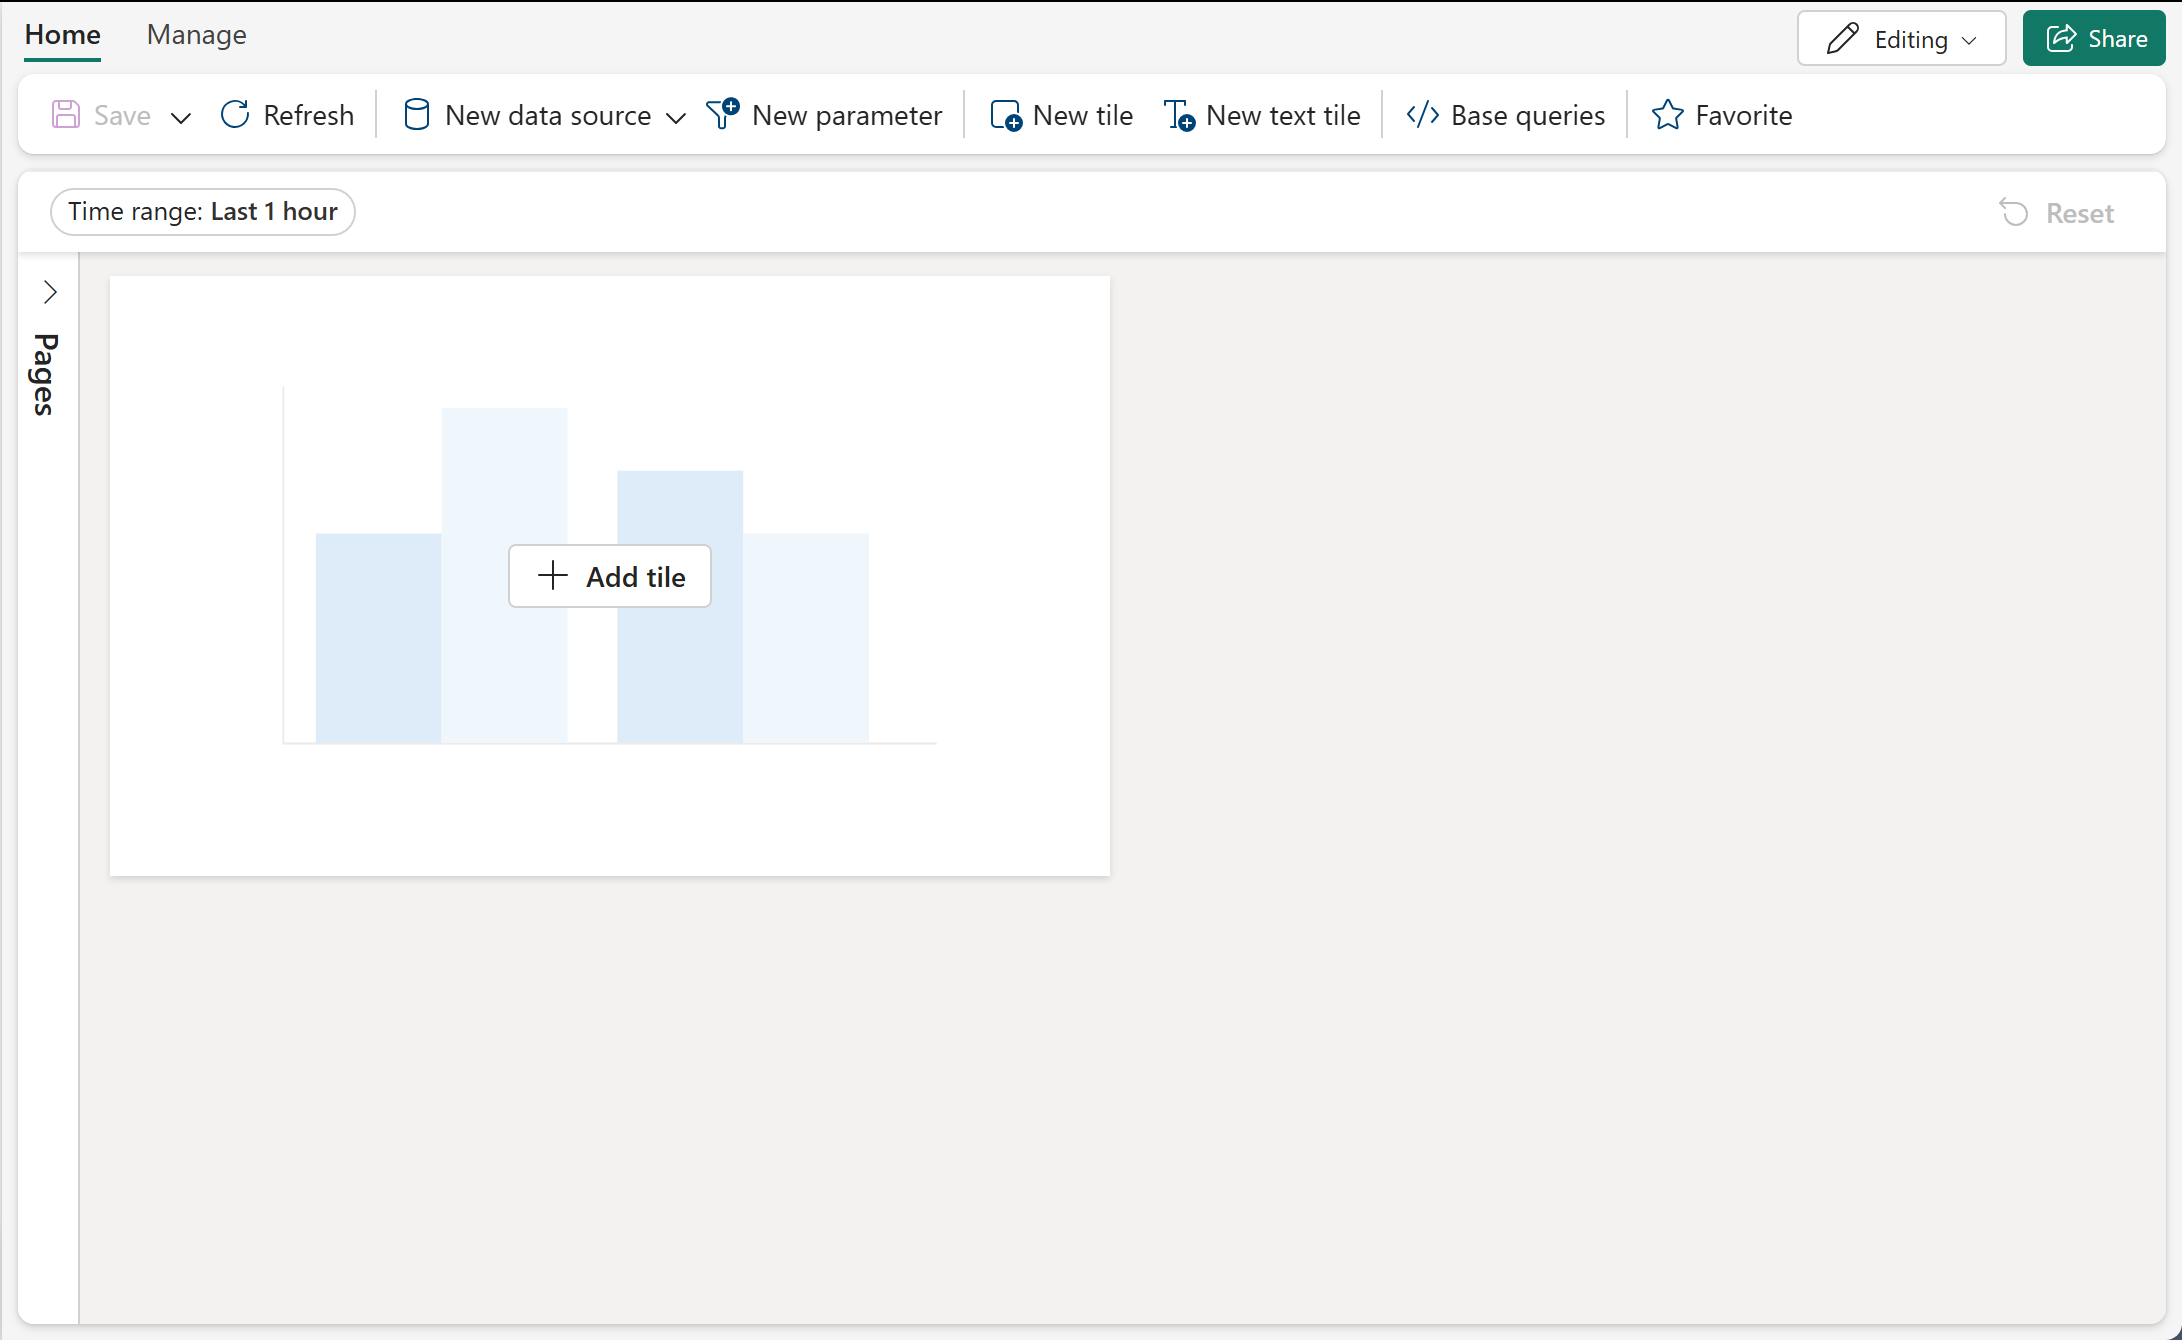
Real-Time Dashboard with data source connected and tiles ready. Source: Create a Real-Time Dashboard
5.2 Configure Dashboard Tiles
Tile 1: Active Floor Summary (Stat Cards)
Query:
SlotEvents
| where event_timestamp > ago(5m)
| summarize
    active_machines = dcount(machine_id),
    active_players = dcount(player_id),
    games_per_minute = round(count() / 5.0, 0),
    total_coin_in = round(sum(coin_in), 2)
Configuration: - Tile type: Stat - Display: 4 values in a row - Formatting: Currency for coin_in, Number for others
Tile 2: Zone Activity Chart
Query:
SlotEvents
| where event_timestamp > ago(1h)
| summarize coin_in = sum(coin_in) by bin(event_timestamp, 5m), zone
| render areachart
Configuration: - Tile type: Area chart - X-axis: event_timestamp - Y-axis: coin_in - Series: zone
Tile 3: Recent Jackpots Table
Query:
SlotEvents
| where event_timestamp > ago(1h)
| where jackpot_amount > 0
| project
    Time = format_datetime(event_timestamp, 'HH:mm:ss'),
    Machine = machine_id,
    Zone = zone,
    Amount = format_number(jackpot_amount, "C")
| order by Time desc
| take 10
Configuration: - Tile type: Table - Enable row highlighting for amounts > $5,000
Tile 4: Alert Panel
Query:
// Combine multiple alert conditions
let hot_machines = SlotEvents
| where event_timestamp > ago(30m)
| where event_type == "GAME_PLAY"
| summarize ci = sum(coin_in), co = sum(coin_out) by machine_id
| where ci > 0
| extend hold = round((ci - co) / ci * 100, 1)
| where hold > 20
| project
    alert_type = "🔥 Hot Machine",
    detail = machine_id,
    value = strcat(tostring(hold), "%"),
    severity = "Warning";
let big_jackpots = SlotEvents
| where event_timestamp > ago(30m)
| where jackpot_amount > 10000
| project
    alert_type = "🎰 Big Jackpot",
    detail = machine_id,
    value = format_number(jackpot_amount, "C"),
    severity = "Info";
let cold_machines = SlotEvents
| where event_timestamp > ago(30m)
| where event_type == "GAME_PLAY"
| summarize ci = sum(coin_in), co = sum(coin_out) by machine_id
| where ci > 100
| extend hold = round((ci - co) / ci * 100, 1)
| where hold < -10
| project
    alert_type = "❄️ Cold Machine",
    detail = machine_id,
    value = strcat(tostring(hold), "%"),
    severity = "Warning";
union hot_machines, big_jackpots, cold_machines
| order by severity asc, alert_type asc
Configuration: - Tile type: Table - Enable conditional formatting by severity
5.3 Set Auto-Refresh
- Click ⚙️ Settings on the dashboard
- Configure:
| Setting | Value |
|---|---|
| Auto refresh | ✅ Enabled |
| Refresh interval | 30 seconds |
- Click Save
5.4 Dashboard Layout Example
┌─────────────────────────────────────────────────────────────────────────┐
│  🎰 CASINO FLOOR MONITOR                    🔄 Auto-refresh: 30s       │
├────────────┬────────────┬────────────┬────────────────────────────────┤
│   🎮       │   👥       │   ⚡       │   💰                           │
│   456      │   892      │   127/min  │   $45,230                      │
│  Machines  │  Players   │   Games    │   Coin In (5m)                 │
├────────────┴────────────┴────────────┴────────────────────────────────┤
│                    📈 ZONE ACTIVITY (Last Hour)                        │
│  ████████████████████████████████████████████████████████████████     │
│  [Area chart showing coin-in by zone over time]                        │
├─────────────────────────────────┬──────────────────────────────────────┤
│  🎰 RECENT JACKPOTS             │  ⚠️ ALERTS                           │
│  ┌────────┬────────┬────────┐   │  ┌─────────┬────────┬────────┐      │
│  │ Time   │Machine │ Amount │   │  │ Type    │ Detail │ Value  │      │
│  ├────────┼────────┼────────┤   │  ├─────────┼────────┼────────┤      │
│  │ 14:32  │SM-0234 │ $5,200 │   │  │🔥 Hot   │SM-0156│  22.5% │      │
│  │ 14:28  │SM-0089 │ $2,100 │   │  │🎰 JP    │SM-0234│ $5,200 │      │
│  │ 14:15  │SM-0445 │ $8,900 │   │  │❄️ Cold  │SM-0301│ -15.2% │      │
│  └────────┴────────┴────────┘   │  └─────────┴────────┴────────┘      │
└─────────────────────────────────┴──────────────────────────────────────┘
🛠️ Step 6: Streaming Data Producer (Testing)
For testing without real Event Hub data, use this Python script to simulate slot machine telemetry.
6.1 Create Event Producer
Create file: data_generation/generators/streaming/event_producer.py
"""
Real-Time Event Producer
Sends simulated slot events to Eventstream for testing
"""

import json
import time
import random
from datetime import datetime
from azure.eventhub import EventHubProducerClient, EventData

# ============================================================
# CONFIGURATION - Update with your Eventstream connection string
# ============================================================
CONNECTION_STRING = "YOUR_EVENTSTREAM_CONNECTION_STRING"
EVENTHUB_NAME = "es_slot_telemetry"

# Simulated casino configuration
MACHINES = [f"SM-{i:05d}" for i in range(1, 501)]
ZONES = ["Main Floor", "High Limit", "VIP", "Penny Palace", "Non-Smoking"]
DENOMINATIONS = [0.01, 0.05, 0.25, 1.00, 5.00]

# Event type distribution (90% gameplay, 2% jackpots, 8% meter updates)
EVENT_TYPES = ["GAME_PLAY", "JACKPOT", "METER_UPDATE"]
EVENT_WEIGHTS = [0.90, 0.02, 0.08]


def generate_event() -> dict:
    """Generate a single slot machine event."""
    machine_id = random.choice(MACHINES)
    event_type = random.choices(EVENT_TYPES, EVENT_WEIGHTS)[0]
    zone = random.choice(ZONES)

    event = {
        "event_id": f"EVT-{datetime.now().strftime('%Y%m%d%H%M%S%f')}",
        "machine_id": machine_id,
        "zone": zone,
        "event_type": event_type,
        "event_timestamp": datetime.utcnow().isoformat() + "Z",
        "denomination": random.choice(DENOMINATIONS),
        "ingestion_time": datetime.utcnow().isoformat() + "Z",
        "coin_in": 0,
        "coin_out": 0,
        "jackpot_amount": 0,
        "player_id": None
    }

    if event_type == "GAME_PLAY":
        # Generate realistic gameplay
        coin_in = round(random.uniform(0.25, 50), 2)

        # House edge ~8% on average
        if random.random() > 0.08:
            coin_out = round(coin_in * random.uniform(0, 2), 2)
        else:
            coin_out = 0

        event["coin_in"] = coin_in
        event["coin_out"] = coin_out

        # 60% of plays have a player card inserted
        if random.random() < 0.6:
            event["player_id"] = f"PLY-{random.randint(1, 10000):06d}"

    elif event_type == "JACKPOT":
        # Generate jackpot win
        jackpot = round(random.uniform(1200, 50000), 2)
        event["jackpot_amount"] = jackpot
        event["player_id"] = f"PLY-{random.randint(1, 10000):06d}"

    return event


def main():
    """Main producer loop."""
    producer = EventHubProducerClient.from_connection_string(
        conn_str=CONNECTION_STRING,
        eventhub_name=EVENTHUB_NAME
    )

    print("=" * 50)
    print("🎰 Casino Event Producer Started")
    print("=" * 50)
    print(f"Target: {EVENTHUB_NAME}")
    print(f"Machines: {len(MACHINES)}")
    print(f"Zones: {len(ZONES)}")
    print("Press Ctrl+C to stop")
    print("=" * 50)

    events_sent = 0
    jackpots_sent = 0
    start_time = time.time()

    try:
        while True:
            # Create batch
            event_batch = producer.create_batch()

            # Generate 10-50 events per batch
            batch_size = random.randint(10, 50)
            batch_jackpots = 0

            for _ in range(batch_size):
                event = generate_event()
                event_batch.add(EventData(json.dumps(event)))
                if event["event_type"] == "JACKPOT":
                    batch_jackpots += 1

            # Send batch
            producer.send_batch(event_batch)
            events_sent += batch_size
            jackpots_sent += batch_jackpots

            # Calculate rate
            elapsed = time.time() - start_time
            rate = events_sent / elapsed if elapsed > 0 else 0

            print(f"\r📤 Events: {events_sent:,} | 🎰 Jackpots: {jackpots_sent} | ⚡ {rate:.1f}/sec", end="")

            # ~100 events/second throughput
            time.sleep(0.1)

    except KeyboardInterrupt:
        elapsed = time.time() - start_time
        print(f"\n\n{'=' * 50}")
        print("🛑 Producer Stopped")
        print(f"Total events sent: {events_sent:,}")
        print(f"Total jackpots: {jackpots_sent}")
        print(f"Duration: {elapsed:.1f} seconds")
        print(f"Average rate: {events_sent/elapsed:.1f} events/second")
        print("=" * 50)
    finally:
        producer.close()


if __name__ == "__main__":
    main()
6.2 Install Dependencies and Run
# Install Azure Event Hub SDK
pip install azure-eventhub

# Run the producer
python data_generation/generators/streaming/event_producer.py
⚠️ Security Note
Never commit the connection string to source control. Use environment variables or Azure Key Vault in production:
🛠️ Step 7: Configure Alerts (Optional)
Set up alerts to notify floor staff of critical events.
7.1 Create Alert Rule in Eventhouse
- In your KQL database, click Alerts > New alert rule
- Configure:
| Setting | Value |
|---|---|
| Name | Big Jackpot Alert |
| Query | See below |
| Frequency | Every 1 minute |
| Condition | Count > 0 |
Alert Query:
SlotEvents
| where event_timestamp > ago(1m)
| where event_type == "JACKPOT"
| where jackpot_amount >= 10000
| project machine_id, zone, jackpot_amount, event_timestamp
7.2 Configure Alert Actions
- Add action: Email notification
-
Recipients: floor-supervisors@casino.com
-
Add action: Teams webhook (optional)
- Webhook URL: Your Teams incoming webhook
7.3 Additional Alert Ideas
| Alert | Query Condition | Notification |
|---|---|---|
| Machine offline | No events for 10+ minutes | Operations team |
| High hold variance | Hold > 20% or < -10% | Slot supervisor |
| Security event | Severity = "High" | Security team |
| VIP player arrival | VIP player card inserted | Host team |
✅ Validation Checklist
Before moving to the next tutorial, verify:
- Eventstream Running - Status shows "Running" with no errors
- Eventhouse Connected - KQL database accessible and receiving data
- Tables Populated - Real-time tables contain recent events
- KQL Queries Work - All monitoring queries return expected results
- Dashboard Live - Real-time dashboard auto-refreshes with current data
- Latency Acceptable - Events appear within 1-5 seconds of generation
🔍 How to verify each item
### Eventstream Running1. Navigate to workspace > Eventstreams
2. Click on your Eventstream
3. Verify:
- Status badge shows "Running" (green)
- No error messages in activity log
- Event flow diagram shows data moving
// In KQL Queryset, test basic connectivity
.show database schema

// Should list all tables in your Eventhouse
// Expected tables: SlotEvents, JackpotEvents, etc.
// Check each table for recent data
SlotEvents
| count

// Should return count > 0

// Check data recency
SlotEvents
| summarize
    LatestEvent = max(event_timestamp),
    OldestEvent = min(event_timestamp),
    EventCount = count()

// LatestEvent should be within last few minutes
// Test all key monitoring queries

// 1. Active machines
SlotEvents
| where event_timestamp > ago(5m)
| summarize by machine_id
| count

// 2. Event type distribution
SlotEvents
| where event_timestamp > ago(1h)
| summarize count() by event_type

// 3. Real-time metrics
SlotEvents
| where event_timestamp > ago(10m)
| summarize
    TotalCoinIn = sum(coin_in),
    TotalWins = sum(coin_out),
    SpinCount = count()
| extend HoldPct = (TotalCoinIn - TotalWins) / TotalCoinIn * 100

// All queries should return results without errors
1. Open your Real-Time Dashboard
2. Verify auto-refresh is enabled (check settings)
3. Watch for data updates:
   - Event count should increment
   - Timestamps should update
   - Charts should redraw with new data
4. Test drill-down interactions
5. Verify all tiles show data (no blank/error tiles)
# Send a test event and measure latency
from datetime import datetime
import time

# 1. Generate test event with current timestamp
test_event = {
    "event_id": f"test_{int(time.time())}",
    "machine_id": "TEST_001",
    "event_type": "spin",
    "event_timestamp": datetime.utcnow().isoformat(),
    "coin_in": 1.00
}

# 2. Send to event hub/stream
# (use your event producer code)

# 3. Query Eventhouse for the test event
start_time = time.time()
// In KQL Queryset, check for test event
SlotEvents
| where machine_id == "TEST_001"
| where event_timestamp > ago(1m)
| take 1
# 4. Calculate latency
latency = time.time() - start_time
print(f"End-to-end latency: {latency:.2f} seconds")
# Should be < 5 seconds for real-time requirements
// Check real-time aggregation accuracy
SlotEvents
| where event_timestamp > ago(1h)
| summarize
    SpinCount = count(),
    TotalCoinIn = sum(coin_in),
    TotalCoinOut = sum(coin_out),
    NetWin = sum(coin_in) - sum(coin_out),
    HoldPct = (sum(coin_in) - sum(coin_out)) / sum(coin_in) * 100
| project
    SpinCount,
    TotalCoinIn = round(TotalCoinIn, 2),
    TotalCoinOut = round(TotalCoinOut, 2),
    NetWin = round(NetWin, 2),
    HoldPct = round(HoldPct, 2)

// Verify metrics look reasonable:
// - Hold % should be 5-15% for slots
// - SpinCount > 0
// - NetWin should be positive (casino advantage)
If you configured Activator alerts:

1. Trigger a test alert condition:
   - Simulate jackpot event
   - Or manually insert test data

2. Verify alert fires:
   - Check email/Teams notification
   - Check Activator activity log
   - Confirm alert shows in dashboard

3. Test alert clearing:
   - Resolve the condition
   - Verify alert clears automatically
🔧 Troubleshooting
Issue: No Data in Tables
| Symptom | Cause | Solution |
|---|---|---|
| Tables empty | Eventstream not running | Check Eventstream status, click Publish |
| Tables empty | Source not connected | Verify Event Hub connection or Custom App |
| Partial data | Mapping mismatch | Verify JSON paths match incoming data structure |
Debug Steps: 1. In Eventstream, check Data preview to see incoming events 2. Verify the ingestion mapping columns match your data 3. Check Ingestion failures in the KQL database
Issue: Query Performance Issues
| Symptom | Cause | Solution |
|---|---|---|
| Slow queries | No time filter | Always include where event_timestamp > ago(...) |
| Timeouts | Too much data | Add take N or narrow time range |
| High latency | Complex aggregations | Pre-aggregate with update policies |
Issue: Dashboard Not Updating
| Symptom | Cause | Solution |
|---|---|---|
| Stale data | Auto-refresh disabled | Enable in dashboard settings |
| No data | Query error | Test query directly in KQL editor |
| Blank tiles | Connection issue | Verify Eventhouse is accessible |
🎉 Summary
Congratulations! You have successfully implemented real-time analytics for casino floor monitoring.
What You Accomplished
- ✅ Created an Eventhouse with KQL database for streaming analytics
- ✅ Defined KQL tables with appropriate schemas and mappings
- ✅ Configured Eventstreams for real-time data ingestion
- ✅ Built KQL queries for floor monitoring, jackpots, and machine performance
- ✅ Created auto-refreshing dashboards for operations visibility
- ✅ (Optional) Configured alerts for critical events
Key Takeaways
| Concept | Key Point |
|---|---|
| Eventhouse | High-performance store optimized for time-series and streaming data |
| Eventstream | Captures, transforms, and routes streaming data to multiple destinations |
| KQL | Powerful query language for real-time analytics with time-based operations |
| Real-Time Dashboard | Auto-refreshing visualizations with sub-second latency |
🚀 Next Steps
Continue your learning journey:
Next Tutorial: Tutorial 05: Direct Lake & Power BI - Build executive dashboards using Direct Lake semantic models
Optional Deep Dives: - Add more sophisticated alerting rules - Create materialized views for common aggregations - Integrate real-time data with Gold layer batch analytics
📚 Resources
| Resource | Link |
|---|---|
| Real-Time Intelligence Overview | Microsoft Learn |
| KQL Quick Reference | KQL Docs |
| Eventstreams Documentation | Eventstreams Guide |
| Real-Time Dashboard | Dashboard Docs |
🧭 Navigation
| Previous | Up | Next |
|---|---|---|
| ⬅️ 03-Gold Layer | 📖 Tutorials Index | 05-Direct Lake & Power BI ➡️ |
Questions or issues? Open an issue in the GitHub repository
Tutorial 04 of 10 in the Microsoft Fabric Casino POC Series