📊 Tutorial 05: Direct Lake & Power BI
Last Updated: 2026-04-15 | Version: 2.0 Status: ✅ Final | Maintainer: Documentation Team



📊 Tutorial 05: Direct Lake & Power BI - Executive Analytics
| Attribute | Details |
|---|---|
| Difficulty | ⭐⭐ Intermediate |
| Time Estimate | ⏱️ 60-90 minutes |
| Focus Area | Business Intelligence |
| Key Skills | Direct Lake, Semantic Models, DAX, Power BI Reports |
📊 Progress Tracker
┌────────┬────────┬────────┬────────┬────────┬────────┬────────┬────────┬────────┬────────┐
│   00   │   01   │   02   │   03   │   04   │   05   │   06   │   07   │   08   │   09   │
│ SETUP  │ BRONZE │ SILVER │  GOLD  │   RT   │  PBI   │ PIPES  │  GOV   │ MIRROR │  AI/ML │
├────────┼────────┼────────┼────────┼────────┼────────┼────────┼────────┼────────┼────────┤
│   ✓    │   ✓    │   ✓    │   ✓    │   ✓    │  📊    │   ○    │   ○    │   ○    │   ○    │
└────────┴────────┴────────┴────────┴────────┴────────┴────────┴────────┴────────┴────────┘
                                                  ▲
                                                  │
                                             YOU ARE HERE
| Navigation | Link |
|---|---|
| ⬅️ Previous | 04-Real-Time Analytics |
| ➡️ Next | 06-Data Pipelines |
📋 Overview
This tutorial covers creating Direct Lake semantic models and Power BI reports for casino executive analytics. Direct Lake provides sub-second query performance directly against Delta tables in OneLake, combining the speed of Import mode with the freshness of DirectQuery.
💡 Why Direct Lake?
Traditional BI approaches require choosing between: - Import mode: Fast queries but stale data (requires refresh) - DirectQuery: Fresh data but slower performance
Direct Lake delivers both: Sub-second queries on always-fresh Delta table data, with no scheduled refresh required.
🎯 Learning Objectives
By the end of this tutorial, you will be able to:
- Understand Direct Lake mode and its benefits
- Create a semantic model from Gold layer tables
- Define table relationships for star schema
- Build DAX measures for casino KPIs
- Create executive and operational Power BI reports
- Configure row-level security (RLS)
🏗️ Direct Lake Architecture
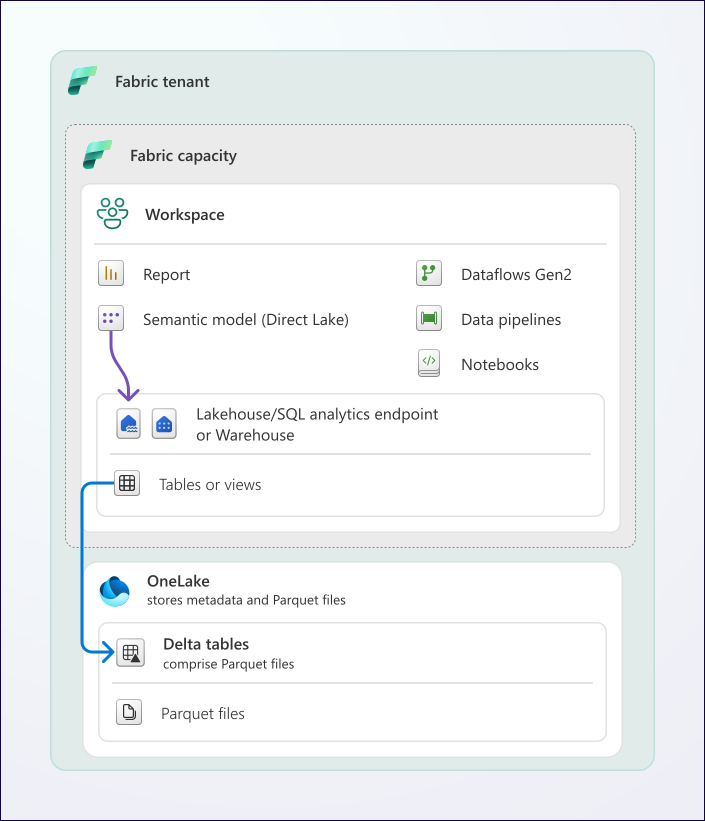
Source: Direct Lake Overview in Microsoft Fabric
flowchart TB
    subgraph OneLake["☁️ OneLake"]
        GOLD[(Gold Delta Tables)]
    end

    subgraph DirectLake["🔗 Direct Lake"]
        SM[Semantic Model]
        REL[Relationships]
        DAX[DAX Measures]
    end

    subgraph PowerBI["📊 Power BI"]
        EXEC[Executive Dashboard]
        OPS[Operations Report]
        COMP[Compliance Report]
    end

    GOLD --> |Direct Lake Connection| SM
    SM --> REL
    REL --> DAX
    DAX --> EXEC
    DAX --> OPS
    DAX --> COMP

    style OneLake fill:#e3f2fd
    style DirectLake fill:#fff8e1
    style PowerBI fill:#e8f5e9
Direct Lake Benefits
| Feature | Description |
|---|---|
| Sub-second queries | Queries execute directly against Delta tables with V-Order optimization |
| No data import | No duplication of data - queries go directly to OneLake |
| Automatic freshness | Data updates are automatically visible without refresh |
| Full DAX support | All DAX calculations, time intelligence, and measures work |
| Fallback protection | Automatically falls back to DirectQuery if needed |
📋 Prerequisites
Before starting this tutorial, ensure you have:
- ✅ Completed Tutorial 03: Gold Layer
- ✅ Gold tables populated in
lh_goldLakehouse: gold_slot_performance,gold_player_360,gold_compliance_reporting,gold_table_analytics,gold_financial_summary,gold_security_dashboard(fact tables from Tutorial 03)dim_date,dim_machine(dimensions — created by notebooks/gold/00_gold_dim_tables.py)gold_player_slot_daily(player-grain fact — created by notebooks/gold/07_gold_player_slot_daily.py)gold_player_table_daily(player-grain fact — created by notebooks/gold/08_gold_player_table_daily.py)- ✅ Power BI license (Pro or Premium Per User)
- ✅ Fabric workspace with semantic model creation permissions
⚠️ Run the three prerequisite notebooks first. Tutorial 03 does not create
dim_date,dim_machine,gold_player_slot_daily, orgold_player_table_daily. Run notebooks/gold/00_gold_dim_tables.py, notebooks/gold/07_gold_player_slot_daily.py, and notebooks/gold/08_gold_player_table_daily.py against your Silver/Gold lakehouses before proceeding. Each takes under a minute.⚠️ License Note
Power BI Pro or Premium Per User (PPU) license is required to create and share semantic models. Users consuming reports need at least a Free license if content is in a Premium capacity.
🛠️ Step 1: Create Semantic Model
1.1 Create from Lakehouse
- Navigate to your workspace (
casino-fabric-poc) - Open the
lh_goldLakehouse - Click New semantic model in the toolbar
- Select all 10 tables to include:
| Table | Type | Purpose |
|---|---|---|
✅ gold_slot_performance | Fact | Daily slot machine performance (machine-day grain) |
✅ gold_player_360 | Dimension | Player profiles and value scores (player grain) |
✅ gold_compliance_reporting | Fact | Regulatory filing summaries (CTR/SAR/W-2G) |
✅ gold_table_analytics | Fact | Table games KPIs at game-day grain |
✅ gold_financial_summary | Fact | Daily P&L and cash flow |
✅ gold_security_dashboard | Fact | Security events and incident tracking |
✅ gold_player_slot_daily | Fact | Slot activity at player-day grain (joins player_360 to slots) |
✅ gold_player_table_daily | Fact | Table games at player-day grain (joins player_360 to tables) |
✅ dim_date | Dimension | Date hierarchy for time intelligence (2020–2030) |
✅ dim_machine | Dimension | Slot machine master data |
Missing tables from the picker?
dim_date/dim_machine→ run notebooks/gold/00_gold_dim_tables.pygold_player_slot_daily→ run notebooks/gold/07_gold_player_slot_daily.pygold_player_table_daily→ run notebooks/gold/08_gold_player_table_daily.py
- Configure semantic model:
| Setting | Value |
|---|---|
| Name | sm_casino_gold |
| Workspace | casino-fabric-poc |
- Click Create
Already created the model with fewer tables? Open
sm_casino_gold→ top ribbon → Home → Get data → OneLake → picklh_gold→ check any missing tables from the list above → Load. They'll join the existing tables without re-creating the model.
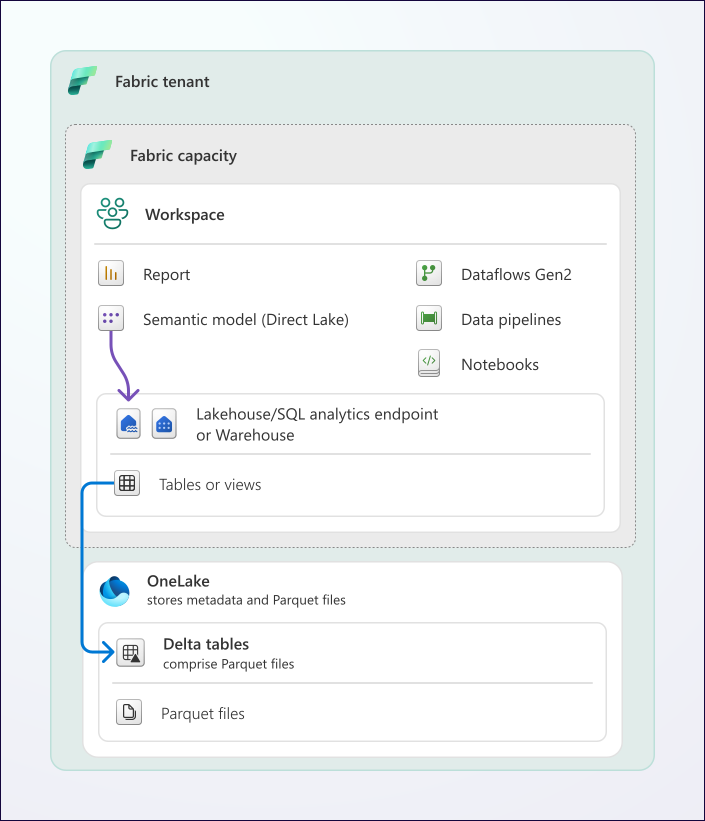
Direct Lake semantic models connect directly to Delta tables in OneLake for optimal performance. Source: Direct Lake overview
1.2 Verify Direct Lake Mode
After creation, verify the model is using Direct Lake:
- Open the semantic model in your workspace
- Click Settings (gear icon)
- Verify Storage mode shows:
Direct Lake - In the model diagram, confirm tables display "DirectLake" badge
💡 Direct Lake Requirements
For Direct Lake to work optimally: - Tables must be Delta format in OneLake - V-Order optimization should be enabled (default in Fabric) - Tables should have reasonable row counts (billions supported) - Complex calculated columns may cause DirectQuery fallback
🛠️ Step 2: Define Table Relationships
A well-designed star schema is critical for optimal query performance and intuitive reporting.
2.1 Open Model View
- Click on the semantic model
- Select Model view from the left panel
2.2 Create Relationships
erDiagram
    dim_date ||--o{ gold_slot_performance : "business_date"
    dim_date ||--o{ gold_compliance_reporting : "report_date"
    dim_date ||--o{ gold_table_analytics : "event_date"
    dim_date ||--o{ gold_financial_summary : "report_date"
    dim_date ||--o{ gold_security_dashboard : "event_date"
    dim_date ||--o{ gold_player_slot_daily : "business_date"
    dim_date ||--o{ gold_player_table_daily : "event_date"
    dim_machine ||--o{ gold_slot_performance : "machine_id"
    gold_player_360 ||--o{ gold_player_slot_daily : "player_id"
    gold_player_360 ||--o{ gold_player_table_daily : "player_id"

    dim_date {
        date date_key PK
        int year
        int quarter
        int month
        int day
        string month_name
        string day_name
        boolean is_weekend
    }

    dim_machine {
        string machine_id PK
        string manufacturer
        string machine_type
        decimal denomination
        string zone
    }

    gold_player_360 {
        string player_id PK
        string loyalty_tier
        boolean vip_flag
        string churn_risk
        decimal player_value_score
    }

    gold_slot_performance {
        date business_date FK
        string machine_id FK
        int unique_players
        decimal total_coin_in
        decimal total_coin_out
        decimal hold_percentage
    }

    gold_table_analytics {
        date event_date FK
        string game_type
        int unique_players
        decimal total_drop
        decimal table_win
    }

    gold_player_slot_daily {
        string player_id FK
        date business_date FK
        decimal total_coin_in
        decimal net_win
        int total_games_played
        int jackpot_count
    }

    gold_player_table_daily {
        string player_id FK
        date event_date FK
        decimal total_drop
        decimal player_net_win
        int total_hands_played
        decimal total_hours_played
    }

    gold_compliance_reporting {
        date report_date FK
        int ctr_count
        int sar_count
        int w2g_count
    }

    gold_financial_summary {
        date report_date FK
        decimal gross_revenue
        decimal total_drop
    }

    gold_security_dashboard {
        date event_date FK
        string zone
        int incident_count
    }
2.3 Configure Each Relationship
Create the 10 relationships below by dragging columns between tables (or via Manage relationships → New). The Many side is always the Fact; the One side is always the Dimension.
Dimension → Fact relationships (dim_date as universal date dimension)
| From (One / Dimension) | From Column | To (Many / Fact) | To Column | Cardinality | Cross-filter |
|---|---|---|---|---|---|
dim_date | date_key | gold_slot_performance | business_date | One-to-Many | Single |
dim_date | date_key | gold_compliance_reporting | report_date | One-to-Many | Single |
dim_date | date_key | gold_table_analytics | event_date | One-to-Many | Single |
dim_date | date_key | gold_financial_summary | report_date | One-to-Many | Single |
dim_date | date_key | gold_security_dashboard | event_date | One-to-Many | Single |
dim_date | date_key | gold_player_slot_daily | business_date | One-to-Many | Single |
dim_date | date_key | gold_player_table_daily | event_date | One-to-Many | Single |
Machine dimension → Slot fact
| From (One / Dimension) | From Column | To (Many / Fact) | To Column | Cardinality | Cross-filter |
|---|---|---|---|---|---|
dim_machine | machine_id | gold_slot_performance | machine_id | One-to-Many | Single |
Player dimension → Player-grain facts
gold_player_360 now joins the model through the two player-grain fact tables (gold_player_slot_daily, gold_player_table_daily). This enables cross-filtering VIP/loyalty/churn slicers against slot and table activity.
| From (One / Dimension) | From Column | To (Many / Fact) | To Column | Cardinality | Cross-filter |
|---|---|---|---|---|---|
gold_player_360 | player_id | gold_player_slot_daily | player_id | One-to-Many | Single |
gold_player_360 | player_id | gold_player_table_daily | player_id | One-to-Many | Single |
Configuration for every relationship
- Cardinality: Many-to-One (from fact to dimension)
- Cross-filter direction: Single
- Make this relationship active: Yes
Ambiguity note. Because
dim_datefilters five facts and several of those facts share natural-key columns (e.g.,report_dateappears on bothgold_compliance_reportingandgold_financial_summary), Power BI may warn about "ambiguous paths." This is expected and safe — each relationship is between distinct tables. If you see a warning about an inactive relationship, that's fine; for a Direct Lake star schema, one active date relationship per fact is what you want.⚠️ Relationship Best Practices. Always use single cross-filter direction for better performance. Avoid bidirectional filters unless absolutely necessary. Use integer keys when possible for faster joins. Validate relationships with sample queries.
🛠️ Step 3: Create DAX Measures
DAX measures provide calculated metrics that respond to filter context in reports.
3.1 Create Measures Table
- In the model view, click New measure
- Create a "Measures" display folder to organize measures

Measures appear in the Data pane with a calculator icon. Source: Create measures in Power BI Desktop

The formula bar displays the DAX expression for the selected measure. Source: Create measures in Power BI Desktop
3.2 Slot Performance Measures
// ===========================================
// SLOT PERFORMANCE MEASURES
// ===========================================

// Total Coin In
Total Coin In =
SUM(gold_slot_performance[total_coin_in])

// Total Coin Out
Total Coin Out =
SUM(gold_slot_performance[total_coin_out])

// Net Win (House Win)
Net Win =
[Total Coin In] - [Total Coin Out]

// Hold Percentage
Hold % =
DIVIDE(
    [Net Win],
    [Total Coin In],
    0
) * 100

// Theoretical Win (based on programmed hold)
Theoretical Win =
SUMX(
    gold_slot_performance,
    gold_slot_performance[total_coin_in] *
    gold_slot_performance[avg_theoretical_hold]
)

// Hold Variance (Actual vs Theoretical)
Hold Variance =
[Net Win] - [Theoretical Win]

// Hold Variance % (for alerting)
Hold Variance % =
DIVIDE(
    [Hold Variance],
    [Theoretical Win],
    0
) * 100

// Total Games Played
Total Games =
SUM(gold_slot_performance[total_games])

// Unique Players
Unique Players =
SUM(gold_slot_performance[unique_players])

// Average Bet
Avg Bet =
DIVIDE(
    [Total Coin In],
    [Total Games],
    0
)

// Win Per Machine
Win Per Machine =
DIVIDE(
    [Net Win],
    DISTINCTCOUNT(gold_slot_performance[machine_id]),
    0
)

// Active Machines Count
Active Machines =
DISTINCTCOUNT(gold_slot_performance[machine_id])
3.3 Player Analytics Measures
// ===========================================
// PLAYER MEASURES
// ===========================================

// Total Players
Total Players =
COUNTROWS(gold_player_360)

// VIP Player Count
VIP Players =
CALCULATE(
    COUNTROWS(gold_player_360),
    gold_player_360[vip_flag] = TRUE()
)

// VIP Percentage
VIP % =
DIVIDE(
    [VIP Players],
    [Total Players],
    0
) * 100

// High Churn Risk Players
High Churn Risk Players =
CALCULATE(
    COUNTROWS(gold_player_360),
    gold_player_360[churn_risk] = "High"
)

// Average Player Value Score
Avg Player Value =
AVERAGE(gold_player_360[player_value_score])

// Total Player Theo
Total Player Theo =
SUM(gold_player_360[total_theo_win])

// Active Players (visited in last 30 days)
Active Players 30D =
CALCULATE(
    COUNTROWS(gold_player_360),
    gold_player_360[days_since_visit] <= 30
)

// Lapsed Players (no visit in 90+ days)
Lapsed Players =
CALCULATE(
    COUNTROWS(gold_player_360),
    gold_player_360[days_since_visit] > 90
)

// Player Retention Rate
Retention Rate 30D =
DIVIDE(
    [Active Players 30D],
    [Total Players],
    0
) * 100
3.4 Compliance Measures
// ===========================================
// COMPLIANCE MEASURES
// ===========================================

// Total CTR Filings
CTR Count =
SUM(gold_compliance_reporting[ctr_count])

// Total SAR Filings
SAR Count =
SUM(gold_compliance_reporting[sar_count])

// Total W2G Filings
W2G Count =
SUM(gold_compliance_reporting[w2g_count])

// Total Regulatory Filings
Total Filings =
[CTR Count] + [SAR Count] + [W2G Count]

// CTR Total Amount
CTR Total Amount =
SUM(gold_compliance_reporting[ctr_total_amount])

// Average Daily Filing Rate
Daily Filing Rate =
DIVIDE(
    [Total Filings],
    DISTINCTCOUNT(gold_compliance_reporting[report_date]),
    0
)

// SAR Rate (per 1000 players)
SAR Rate =
DIVIDE(
    [SAR Count],
    [Total Players] / 1000,
    0
)
3.5 Time Intelligence Measures
// ===========================================
// TIME INTELLIGENCE MEASURES
// ===========================================

// Coin In - Month to Date
Coin In MTD =
TOTALMTD(
    [Total Coin In],
    dim_date[date_key]
)

// Coin In - Year to Date
Coin In YTD =
TOTALYTD(
    [Total Coin In],
    dim_date[date_key]
)

// Net Win - Previous Month
Net Win PM =
CALCULATE(
    [Net Win],
    DATEADD(dim_date[date_key], -1, MONTH)
)

// Net Win - Month over Month Growth %
Net Win MoM % =
VAR CurrentMonth = [Net Win]
VAR PreviousMonth = [Net Win PM]
RETURN
DIVIDE(
    CurrentMonth - PreviousMonth,
    PreviousMonth,
    0
) * 100

// Net Win - Previous Year
Net Win PY =
CALCULATE(
    [Net Win],
    SAMEPERIODLASTYEAR(dim_date[date_key])
)

// Net Win - Year over Year Growth %
Net Win YoY % =
VAR CurrentPeriod = [Net Win]
VAR PreviousYear = [Net Win PY]
RETURN
DIVIDE(
    CurrentPeriod - PreviousYear,
    PreviousYear,
    0
) * 100

// 7-Day Rolling Average Coin In
Coin In 7D Avg =
AVERAGEX(
    DATESINPERIOD(
        dim_date[date_key],
        MAX(dim_date[date_key]),
        -7,
        DAY
    ),
    [Total Coin In]
)

// 30-Day Rolling Average Net Win
Net Win 30D Avg =
AVERAGEX(
    DATESINPERIOD(
        dim_date[date_key],
        MAX(dim_date[date_key]),
        -30,
        DAY
    ),
    [Net Win]
)
💡 DAX Best Practices
- Use measures over calculated columns for better performance
- Avoid FILTER() with large tables - use simpler predicates
- Use variables (VAR) to improve readability and avoid recalculation
- Test measures with different filter contexts before deploying
🛠️ Step 4: Create Executive Dashboard
4.1 Create New Report
- From the semantic model, click Create report
- Or in Power BI service: + New > Report > Select
Casino Analytics Model - The report canvas opens in edit mode
4.2 Page 1: Executive Summary
Layout Design
┌─────────────────────────────────────────────────────────────────────────────────┐
│  🎰 CASINO EXECUTIVE DASHBOARD                        📅 Date: [Date Slicer]   │
├──────────────┬──────────────┬──────────────┬──────────────┬────────────────────┤
│   💰         │    📊        │    👥        │    🎮        │   🏷️ Zone Filter   │
│   $2.5M      │    8.2%      │   12,450     │    1.2M      │   [Dropdown]       │
│   Net Win    │   Hold %     │   Players    │   Games      │                    │
│   ▲ +5.2%    │   ▼ -0.3%    │   ▲ +2.1%    │   ▲ +8.4%    │                    │
├──────────────┴──────────────┴──────────────┴──────────────┴────────────────────┤
│                         📈 NET WIN TREND (30 Days)                              │
│  ████████████████████████████████████████████████████████████████████████████  │
│  [Line Chart - Daily Net Win with trend line and target]                        │
├─────────────────────────────────────────┬───────────────────────────────────────┤
│   📊 PERFORMANCE BY ZONE                │   🏆 TOP 10 MACHINES                  │
│   ┌─────────────────────────────┐       │   ┌─────────────────────────────────┐ │
│   │ ████████████ Main Floor     │       │   │ Machine  │ Zone   │ Net Win    │ │
│   │ ██████████ High Limit       │       │   │ SM-0234  │ VIP    │ $45,230    │ │
│   │ ████████ VIP                │       │   │ SM-0089  │ HL     │ $38,420    │ │
│   │ ██████ Penny Palace         │       │   │ SM-0445  │ Main   │ $32,100    │ │
│   └─────────────────────────────┘       │   └─────────────────────────────────┘ │
├─────────────────────────────────────────┼───────────────────────────────────────┤
│   📋 COMPLIANCE SUMMARY                 │   👥 PLAYER TIER DISTRIBUTION         │
│   ┌────────┬────────┬────────┐          │        ┌─────────────┐                │
│   │  CTR   │  SAR   │  W2G   │          │       ╱  Platinum   ╲                │
│   │   45   │   12   │  234   │          │      ╱    Gold       ╲               │
│   │ $4.2M  │        │ $1.8M  │          │     ╱     Silver      ╲              │
│   └────────┴────────┴────────┘          │    ╱      Bronze       ╲             │
│                                          │        [Donut Chart]                 │
└─────────────────────────────────────────┴───────────────────────────────────────┘
Create Visuals
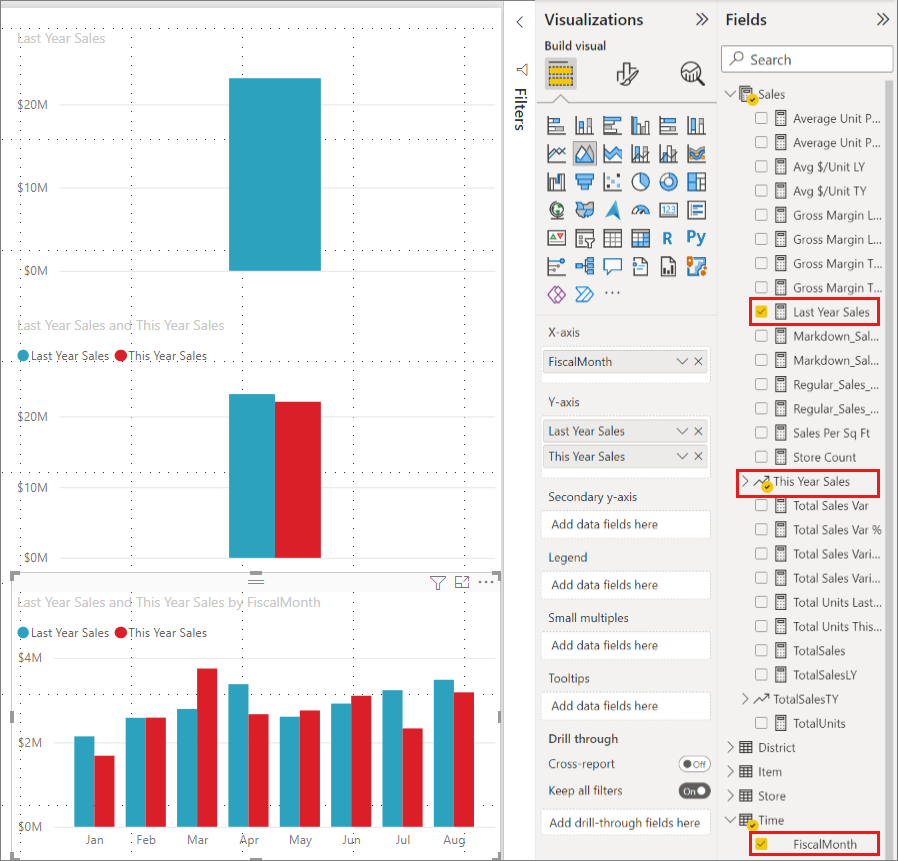
Drag fields from the Data pane to create visualizations on the report canvas. Source: Report view in Power BI Desktop

Visualizations powered by DAX measures for business analytics. Source: Create measures in Power BI Desktop
1. KPI Cards (Top Row)
Create 4 card visuals with conditional formatting:
| Card | Measure | Format | Trend |
|---|---|---|---|
| Net Win | [Net Win] | Currency, $0.0M | Compare to [Net Win PM] |
| Hold % | [Hold %] | Percentage, 0.0% | Target: 8.0% |
| Unique Players | [Unique Players] | Number, #,##0 | Compare to previous |
| Total Games | [Total Games] | Number, 0.0M | Compare to previous |
2. Net Win Trend (Line Chart)
| Property | Value |
|---|---|
| X-axis | dim_date[date_key] |
| Y-axis | [Net Win] |
| Secondary Y-axis | [Net Win 30D Avg] (trend line) |
| Reference line | Target value or previous period |
3. Performance by Zone (Bar Chart)
| Property | Value |
|---|---|
| Y-axis | gold_slot_performance[zone] |
| X-axis | [Net Win] |
| Sort | Descending by Net Win |
| Data colors | Conditional by performance |
4. Top 10 Machines (Table)
| Column | Measure/Field |
|---|---|
| Machine ID | gold_slot_performance[machine_id] |
| Zone | gold_slot_performance[zone] |
| Net Win | [Net Win] |
| Hold % | [Hold %] |
| Games | [Total Games] |
Apply Top N filter: Top 10 by Net Win
5. Compliance Summary (Multi-row Card)
| Metric | Measure |
|---|---|
| CTR Count | [CTR Count] |
| SAR Count | [SAR Count] |
| W2G Count | [W2G Count] |
| CTR Amount | [CTR Total Amount] |
6. Player Tier Distribution (Donut Chart)
| Property | Value |
|---|---|
| Legend | gold_player_360[loyalty_tier] |
| Values | Count of player_id |
| Colors | Platinum (gold), Gold, Silver, Bronze |
4.3 Page 2: Slot Operations
Layout Design
┌─────────────────────────────────────────────────────────────────────────────────┐
│  🎰 SLOT OPERATIONS                     📅 Date: [Range]  🏷️ Zone: [Multi]     │
├─────────────────────────────────────────────────────────────────────────────────┤
│                    📊 MACHINE PERFORMANCE MATRIX                                 │
│  ┌───────────────────────────────────────────────────────────────────────────┐  │
│  │ Zone/Denom  │  $0.01  │  $0.05  │  $0.25  │  $1.00  │  $5.00  │  Total   │  │
│  ├─────────────┼─────────┼─────────┼─────────┼─────────┼─────────┼──────────┤  │
│  │ Main Floor  │  $125K  │  $89K   │  $234K  │  $456K  │  $78K   │  $982K   │  │
│  │ High Limit  │    -    │    -    │  $45K   │  $234K  │  $567K  │  $846K   │  │
│  └───────────────────────────────────────────────────────────────────────────┘  │
├─────────────────────────────────────────┬───────────────────────────────────────┤
│   📈 HOURLY ACTIVITY PATTERN            │   📊 HOLD VARIANCE ANALYSIS           │
│   ┌─────────────────────────────┐       │   ┌─────────────────────────────────┐ │
│   │ [Area chart by hour]        │       │   │ [Scatter: Theo vs Actual]       │ │
│   │                             │       │   │   x: Theoretical Win             │ │
│   │ Peak: 8PM-11PM              │       │   │   y: Actual Win                  │ │
│   │ Low: 4AM-7AM                │       │   │   Color by variance              │ │
│   └─────────────────────────────┘       │   └─────────────────────────────────┘ │
├─────────────────────────────────────────┼───────────────────────────────────────┤
│   🏭 MANUFACTURER PERFORMANCE           │   🎰 JACKPOT SUMMARY                  │
│   ┌─────────────────────────────┐       │   ┌─────────────────────────────────┐ │
│   │ [Clustered bar chart]       │       │   │ Total Jackpots: 234             │ │
│   │   - IGT                     │       │   │ Total Amount: $1.2M             │ │
│   │   - Aristocrat              │       │   │ Largest: $45,230 (SM-0234)      │ │
│   │   - Scientific Games        │       │   │ [Table of recent jackpots]      │ │
│   └─────────────────────────────┘       │   └─────────────────────────────────┘ │
└─────────────────────────────────────────┴───────────────────────────────────────┘
Key Visuals
1. Performance Matrix - Visual type: Matrix - Rows: Zone - Columns: Denomination - Values: Net Win, Hold %, Games
2. Hold Variance Scatter Plot - X-axis: Theoretical Win - Y-axis: Net Win (Actual) - Size: Total Games - Color saturation: Hold Variance % - Reference line: y=x (where actual = theoretical)
4.4 Page 3: Player Analytics
Layout Design
┌─────────────────────────────────────────────────────────────────────────────────┐
│  👥 PLAYER ANALYTICS                           🏷️ Tier: [Slicer] 📅 [Date]     │
├──────────────┬──────────────┬──────────────┬────────────────────────────────────┤
│   👥         │   ⭐         │    ⚠️        │    📈                               │
│   45,230     │   2,340      │    1,256     │    72.5                            │
│   Total      │   VIP        │   At Risk    │    Avg Value                       │
│   Players    │   Players    │   (Churn)    │    Score                           │
├──────────────┴──────────────┴──────────────┴────────────────────────────────────┤
│                    📊 PLAYER VALUE DISTRIBUTION                                  │
│  ┌───────────────────────────────────────────────────────────────────────────┐  │
│  │ [Histogram of player_value_score with normal curve overlay]               │  │
│  └───────────────────────────────────────────────────────────────────────────┘  │
├─────────────────────────────────────────┬───────────────────────────────────────┤
│   📊 TIER BREAKDOWN                     │   ⚠️ CHURN RISK ANALYSIS             │
│   ┌─────────────────────────────┐       │   ┌─────────────────────────────────┐ │
│   │ [Stacked bar by tier]       │       │   │ [Pie: High/Medium/Low risk]     │ │
│   │   Platinum: 5%              │       │   │                                 │ │
│   │   Gold: 15%                 │       │   │   High: 12%                     │ │
│   │   Silver: 30%               │       │   │   Medium: 28%                   │ │
│   │   Bronze: 50%               │       │   │   Low: 60%                      │ │
│   └─────────────────────────────┘       │   └─────────────────────────────────┘ │
├─────────────────────────────────────────────────────────────────────────────────┤
│                    🏆 TOP PLAYERS BY THEORETICAL VALUE                          │
│  ┌───────────────────────────────────────────────────────────────────────────┐  │
│  │ Player ID  │  Tier     │  Total Theo  │  Visits  │  Churn Risk  │ Action  │  │
│  │ PLY-00234  │ Platinum  │   $125,000   │   45     │    Low       │  [View] │  │
│  │ PLY-00892  │ Platinum  │   $98,500    │   38     │    Medium    │  [View] │  │
│  └───────────────────────────────────────────────────────────────────────────────┘ │
└─────────────────────────────────────────────────────────────────────────────────┘
🛠️ Step 5: Configure Report Settings
5.1 Publish Report
- Save the report: File > Save as >
Casino Executive Dashboard - Click Publish
- Select workspace:
casino-fabric-poc
5.2 Verify Direct Lake Refresh
For Direct Lake semantic models, data updates are automatic:
- Open the report in Power BI service
- Click Settings (gear icon) on the semantic model
- Verify under Refresh:
- Shows: "Direct Lake - data is always current"
- No scheduled refresh is needed
💡 Direct Lake Refresh Behavior
- Data changes in Delta tables are visible within seconds
- No manual refresh button needed
- If framing (metadata sync) is needed, it happens automatically
- Monitor with semantic model refresh history for any issues
5.3 Configure Row-Level Security (RLS)
Restrict data access by user role (e.g., zone managers see only their zones).
Create RLS Role
- Open semantic model in Edit mode
- Go to Modeling > Manage roles
- Create new role:
Zone Manager
Define DAX Filter
// RLS Rule: Zone-based access
// Users see only their assigned zone(s)
[Zone Security] =
VAR UserZones =
    LOOKUPVALUE(
        UserZoneMapping[Zone],
        UserZoneMapping[UserEmail],
        USERPRINCIPALNAME()
    )
RETURN
    gold_slot_performance[zone] = UserZones
    || UserZones = "All"  // "All" grants full access
Alternative: Multiple Zones per User
// RLS Rule: Support multiple zones per user
[Zone Security Multi] =
VAR UserEmail = USERPRINCIPALNAME()
VAR AllowedZones =
    CALCULATETABLE(
        VALUES(UserZoneMapping[Zone]),
        UserZoneMapping[UserEmail] = UserEmail
    )
RETURN
    gold_slot_performance[zone] IN AllowedZones
    || "All" IN AllowedZones
Test RLS
- Click View as role in Power BI Desktop
- Select
Zone Managerrole - Enter test user email
- Verify data is filtered correctly
🛠️ Step 6: Create Paginated Report (Optional)
For compliance reporting requiring exact formatting and pagination.
6.1 Use Power BI Report Builder
- Download Power BI Report Builder (free)
- Create new report connecting to semantic model
- Design compliance-friendly layouts:
- CTR summary with transaction details
- SAR filing log with timestamps
- W2G jackpot listing with IRS form format
6.2 Paginated Report Features
| Feature | Use Case |
|---|---|
| Pixel-perfect formatting | Regulatory forms requiring exact layout |
| Multi-page export | Reports spanning multiple pages |
| Parameterized | Date range, zone, filing type filters |
| Export formats | PDF, Excel, Word for regulator submission |
✅ Validation Checklist
Before moving to the next tutorial, verify:
- Direct Lake Semantic Model Created - Model exists with Direct Lake storage mode
- Reports Load Successfully - Executive dashboard opens without errors
- Visuals Display Data - All charts and tables show current data
- Relationships Work - Drill-through and filters function correctly
- DAX Measures Calculate - All KPIs return expected values
- Auto-Refresh Works - Data changes appear within seconds
🔍 How to verify each item
### Direct Lake Semantic Model Created1. Navigate to workspace
2. Look for semantic model (dataset icon)
3. Click on model > Settings
4. Under "Storage mode" section, verify:
✅ "Direct Lake" is selected
✅ Source lakehouse shows "lh_gold"
✅ Status shows "Connected"
1. Open "Casino Executive Dashboard" report
2. Verify:
   - Report loads without error messages
   - All pages accessible (Executive Summary, Slot Performance, Player Insights)
   - No "Can't load visual" errors
   - Data loads within 5-10 seconds
Check each visual on each page:

Page 1 - Executive Summary:
✅ Total Revenue card shows value
✅ Hold % gauge displays percentage
✅ Daily trend line chart shows data points
✅ Top machines table populated

Page 2 - Slot Performance:
✅ Machine heatmap shows color gradients
✅ Performance matrix has data
✅ Trend over time chart displays lines

Page 3 - Player Insights:
✅ Player segmentation chart shows segments
✅ Value tier distribution populated
✅ Top players table shows names/metrics
Test relationship functionality:

1. Click-through test:
   - Click a zone in bar chart
   - Verify all other visuals filter to that zone

2. Slicer test:
   - Select date range in date slicer
   - Verify all visuals update for that period

3. Drill-through test:
   - Right-click a machine in the table
   - Select "Drill through" > Machine Details
   - Verify detail page shows correct machine data
Verify key DAX measures in report:

✅ [Total Coin In] - Should be > $0
✅ [Total Net Win] - Should be positive
✅ [Hold %] - Should be between 5-15%
✅ [Theoretical Win] - Should be > $0
✅ [Variance to Theo] - Should be ± reasonable
✅ [Player Count] - Should be > 0

Test a measure manually:
- Select a measure in Fields pane
- Click "Table view" in Modeling tab
- Verify it calculates without errors
# 1. Update Gold layer data
from pyspark.sql.functions import col, lit

# Add a test record with recognizable values
df = spark.table("lh_gold.gold_slot_performance").limit(1)
test_record = df.withColumn("net_win", lit(99999.99))
test_record.write.format("delta").mode("append").saveAsTable("lh_gold.gold_slot_performance")

print("✅ Test record added with net_win = 99999.99")
2. In Power BI:
   - Open the report (or refresh if already open)
   - Navigate to Slot Performance page
   - Look for the test machine
   - Verify net_win shows 99999.99
   - Data should appear within 5-10 seconds (no manual refresh needed!)
Test query performance:

1. Open report in Power BI Desktop or Service
2. Enable Performance Analyzer (View > Performance Analyzer)
3. Click "Start recording"
4. Refresh all visuals (Ctrl+R)
5. Click "Stop recording"

Expected performance:
✅ Visual queries: < 2 seconds each
✅ DAX queries: < 1 second for most measures
✅ Page load: < 5 seconds
🔧 Performance Optimization
For Direct Lake
| Optimization | Description |
|---|---|
| Pre-aggregate in Gold | Create summary tables for common aggregations |
| Limit columns | Only include needed columns in semantic model |
| Use numeric keys | Integer keys are faster than string keys |
| Avoid complex calculated columns | Use measures instead |
| Monitor fallback | Check if queries fall back to DirectQuery |
For Reports
| Optimization | Description |
|---|---|
| Limit visuals per page | 6-8 visuals maximum for performance |
| Use slicers efficiently | Dropdown for high-cardinality fields |
| Avoid ALLEXCEPT/ALL | These can cause full table scans |
| Use bookmarks | For pre-filtered views instead of complex filters |
| Test with production data | Validate performance with realistic volumes |
Monitoring Direct Lake
Check the semantic model for fallback indicators:
// Query to identify fallback scenarios
// Run in DAX Studio or external tools
EVALUATE
INFO.STORAGETABLECOLUMNS()
🔧 Troubleshooting
Issue: Fallback to DirectQuery Mode
| Symptom | Cause | Solution |
|---|---|---|
| Slow queries | DirectQuery fallback | Check for unsupported DAX patterns |
| "DQ" indicator | Complex calculations | Simplify calculated columns |
| Timeout errors | Large table scans | Add filters, pre-aggregate |
Common fallback triggers: - Complex calculated columns with RELATED() - Very large tables (check row counts) - Certain DAX functions on large datasets
Issue: Slow Query Performance
| Symptom | Cause | Solution |
|---|---|---|
| Report loads slowly | Too many visuals | Reduce visual count per page |
| Slicers lag | High cardinality | Use dropdown, add search |
| Aggregations slow | No pre-aggregation | Create Gold summary tables |
Issue: Data Not Refreshing
| Symptom | Cause | Solution |
|---|---|---|
| Stale data | Framing issue | Check semantic model refresh logs |
| No updates | Table not synced | Verify OneLake sync status |
| Partial updates | Delta log issues | Rebuild Delta table |
🎉 Summary
Congratulations! You have successfully built executive analytics using Direct Lake and Power BI.
What You Accomplished
- ✅ Created a Direct Lake semantic model for casino analytics
- ✅ Defined table relationships for star schema
- ✅ Built DAX measures for slot, player, and compliance KPIs
- ✅ Created time intelligence calculations (MTD, YTD, trends)
- ✅ Designed executive dashboards with automatic data refresh
- ✅ Configured row-level security for zone-based access
Key Takeaways
| Concept | Key Point |
|---|---|
| Direct Lake | Combines Import speed with DirectQuery freshness |
| No Refresh Needed | Data updates automatically from Delta tables |
| Star Schema | Fact + Dimension tables for optimal performance |
| DAX Measures | Dynamic calculations that respond to filter context |
| RLS | Secure data access by user role |
Architecture Achieved
flowchart LR
    subgraph Data["🗄️ Data Layer"]
        DT[Delta Tables<br/>Gold Layer]
    end

    subgraph Semantic["📊 Semantic Layer"]
        DL[Direct Lake<br/>Semantic Model]
    end

    subgraph Reporting["📈 Reporting Layer"]
        EXEC[Executive<br/>Dashboard]
        OPS[Operations<br/>Report]
        COMP[Compliance<br/>Report]
    end

    DT --> |Auto-sync| DL
    DL --> EXEC
    DL --> OPS
    DL --> COMP

    style Data fill:#e3f2fd
    style Semantic fill:#fff8e1
    style Reporting fill:#e8f5e9
🚀 Next Steps
Continue your learning journey:
Next Tutorial: Tutorial 06: Data Pipelines - Orchestrate end-to-end data workflows
Optional Deep Dives: - Add more sophisticated DAX calculations - Create mobile-optimized report layouts - Implement Q&A natural language queries - Set up email subscriptions and alerts
📚 Resources
| Resource | Link |
|---|---|
| Direct Lake Overview | Microsoft Learn |
| DAX Reference | DAX Guide |
| Power BI Best Practices | Guidance Docs |
| Semantic Model Design | Star Schema Guide |
| Row-Level Security | RLS Documentation |
🧭 Navigation
| Previous | Up | Next |
|---|---|---|
| ⬅️ 04-Real-Time Analytics | 📖 Tutorials Index | 06-Data Pipelines ➡️ |
Questions or issues? Open an issue in the GitHub repository
Tutorial 05 of 10 in the Microsoft Fabric Casino POC Series