Home > Tutorials > Geolocation Analytics
📍 Tutorial 29: Geolocation Analytics
Last Updated: 2026-04-15 | Version: 2.0 Status: ✅ Final | Maintainer: Documentation Team
Third-party references — publicly sourced, good-faith comparison
This page references non-Microsoft products and services. That information is drawn from each vendor's publicly available documentation and is offered for honest, good-faith comparison only. This is a personal project written from a Microsoft Fabric and Azure perspective; it does not claim expertise in, or authority over, any third-party product, and nothing here is an official statement by, or endorsed by, those vendors. Capabilities, pricing, and features change often — always verify against the vendor's current official documentation. Where a third-party offering is the stronger choice, we say so plainly.
📍 Tutorial 29: Geolocation Analytics
| Difficulty | ⭐⭐⭐ Advanced |
| Time | ⏱️ 120-150 minutes |
| Focus | Geospatial Analytics, H3 Indexing, Geofencing & Proximity Marketing |
📊 Progress Tracker
┌──────┬──────┬──────┬──────┬──────┬──────┬──────┬──────┬──────┬──────┬──────┬──────┬──────┬──────┐
│  00  │  01  │  02  │  03  │  04  │  05  │  06  │  07  │  08  │  09  │  10  │  11  │  12  │  13  │
│SETUP │BRNZE │SILVR │ GOLD │  RT  │ PBI  │PIPES │ GOV  │MIRRR │AI/ML │TDATA │ SAS  │CICD  │MIGR  │
├──────┼──────┼──────┼──────┼──────┼──────┼──────┼──────┼──────┼──────┼──────┼──────┼──────┼──────┤
│  ✅  │  ✅  │  ✅  │  ✅  │  ✅  │  ✅  │  ✅  │  ✅  │  ✅  │  ✅  │  ✅  │  ✅  │  ✅  │  ✅  │
└──────┴──────┴──────┴──────┴──────┴──────┴──────┴──────┴──────┴──────┴──────┴──────┴──────┴──────┘

┌──────┬──────┬──────┬──────┬──────┬──────┬──────┬──────┬──────┬──────┬──────┬──────┬──────┬──────┬──────┬──────┬──────┬──────┐
│  14  │  15  │  16  │  17  │  18  │  19  │  20  │  21  │  22  │  23  │  24  │  25  │  26  │  27  │  28  │  29  │  30  │  31  │
│ SEC  │ COST │PERF  │ MON  │SHARE │COPLT │WKBST │ GEO  │ NET  │SHIR  │ SNW  │ DB2  │MULTI │VIDEO │ MOVE │GEOLC │TRIBL │ DOT  │
├──────┼──────┼──────┼──────┼──────┼──────┼──────┼──────┼──────┼──────┼──────┼──────┼──────┼──────┼──────┼──────┼──────┼──────┤
│  ✅  │  ✅  │  ✅  │  ✅  │  ✅  │  ✅  │  ✅  │  ✅  │  ✅  │  ✅  │  ✅  │  ✅  │  ✅  │  ✅  │  ✅  │  🔵  │  ○   │  ○   │
└──────┴──────┴──────┴──────┴──────┴──────┴──────┴──────┴──────┴──────┴──────┴──────┴──────┴──────┴──────┴──────┴──────┴──────┘
                                                                                                          ▲
                                                                                                   YOU ARE HERE
| Navigation | |
|---|---|
| ⬅️ Previous | 28-People Movement Analytics |
| ➡️ Next | 30-Tribal Healthcare Analytics |
📖 Overview
Casino resorts span hundreds of thousands of square feet across gaming floors, hotel towers, parking structures, restaurants, pools, and entertainment venues. Understanding where patrons, employees, and assets are at any given moment transforms operations from reactive to predictive. This tutorial teaches you to build a complete geolocation analytics pipeline in Microsoft Fabric -- from GPS receivers and indoor positioning beacons through H3 spatial indexing and geofence-triggered marketing to real-time heat-map dashboards.
You will ingest location signals from multiple positioning systems (GPS, Wi-Fi, BLE, UWB), index them with Uber's H3 hexagonal spatial system for sub-second aggregation, evaluate geofence boundary crossings to trigger proximity offers, and surface patron journey intelligence through Power BI geospatial visuals. The architecture builds directly on Tutorial 21: GeoAnalytics & ArcGIS by extending regional-scale market analytics to meter-level indoor positioning and real-time patron tracking.
💡 Why Geolocation Analytics?
- Proximity marketing: Push a steakhouse coupon when a Diamond loyalty patron walks past the restaurant entrance
- Journey optimization: Identify that patrons who visit the sportsbook first spend 30% more at the casino bar
- Operational efficiency: Track shuttle fleet positions, valet vehicle dwell times, and security patrol coverage
- Compliance: Verify that minors detected in restricted gaming zones trigger immediate security dispatch
Source: Lakehouse Overview
🎯 Learning Objectives
By the end of this tutorial, you will be able to:
- Compare positioning technologies (GPS, Wi-Fi, BLE, UWB) and select the right mix for casino resort operations
- Define geofence zones using circular, polygon, and H3 hex boundaries for casino floor regions
- Implement Uber H3 spatial indexing at resolutions 7-12 for casino-scale aggregation
- Ingest real-time location events through Fabric Eventstreams into a Bronze Delta table
- Process location data through Silver layer transformations including H3 computation, geofence evaluation, and speed/heading derivation
- Build Gold layer location intelligence with patron journey mapping, dwell time analysis, and revenue attribution by zone
- Create DAX measures for proximity-triggered marketing conversion rates and zone profitability
- Visualize geolocation data using Power BI map visuals, H3 hex grids, and patron journey animations
- Integrate with ArcGIS GeoAnalytics Engine for advanced spatial analysis (see Tutorial 21)
- Troubleshoot common geospatial data quality issues including GPS drift, indoor signal loss, and coordinate precision
🏗️ Architecture Diagram
%%{init: {'theme':'base', 'themeVariables': {'primaryColor':'#2196F3','primaryTextColor':'#fff','primaryBorderColor':'#1565C0','lineColor':'#1976D2','secondaryColor':'#E3F2FD','tertiaryColor':'#fff'}}}%%
flowchart TB
    subgraph Sources["📡 Positioning Systems"]
        GPS["🛰️ GPS Receivers\n(Outdoor: Parking, Shuttles)"]
        WIFI["📶 Wi-Fi APs\n(Indoor Triangulation)"]
        BLE["📱 BLE Beacons\n(Floor-Level Precision)"]
        UWB["📏 UWB Anchors\n(Sub-Meter Accuracy)"]
    end

    subgraph Ingestion["☁️ Cloud Ingestion"]
        IOT["📡 Azure IoT Hub\n(Device Registry)"]
        ES["⚡ Eventstreams\n(Stream Processing)"]
    end

    subgraph Lakehouse["🔷 Microsoft Fabric Lakehouse"]
        BRZ["🥉 Bronze\n(Raw Location Events)"]
        SLV["🥈 Silver\n(H3 Index + Geofence + POI)"]
        GLD["🥇 Gold\n(Journey Maps + KPIs)"]
    end

    subgraph Processing["⚙️ Spark Processing"]
        H3["🔷 H3 Spatial Index\n(h3-pyspark)"]
        SED["🌐 Apache Sedona\n(Spatial Joins)"]
        GEO["📍 Geofence Engine\n(Point-in-Polygon)"]
    end

    subgraph Output["📊 Analytics & Actions"]
        PBI["📊 Power BI\n(Map Visuals + H3 Grid)"]
        ARC["🗺️ ArcGIS\n(Advanced GeoAnalytics)"]
        MKT["🎯 Proximity Marketing\n(Triggered Offers)"]
    end

    GPS --> IOT
    WIFI --> IOT
    BLE --> IOT
    UWB --> IOT
    IOT --> ES
    ES --> BRZ
    BRZ --> H3
    BRZ --> GEO
    H3 --> SLV
    GEO --> SLV
    SED --> SLV
    SLV --> GLD
    GLD --> PBI
    GLD --> ARC
    GLD --> MKT

    style Sources fill:#E3F2FD
    style Ingestion fill:#FFF3E0
    style Lakehouse fill:#E8F5E9
    style Processing fill:#F3E5F5
style Output fill:#FCE4EC | Component | Technology | Purpose |
|---|---|---|
| Positioning | GPS / Wi-Fi / BLE / UWB | Capture device coordinates at varying precision levels |
| Ingestion | Azure IoT Hub + Eventstreams | Register devices, route location telemetry at scale |
| Bronze | Delta Lake (append-only) | Store raw location events with full fidelity |
| Spatial Processing | h3-pyspark, Apache Sedona | Compute hex indices, evaluate geofence boundaries, calculate proximity |
| Silver | Delta Lake (validated) | Enriched events with H3 index, geofence zone, nearest POI |
| Gold | Delta Lake (aggregated) | Patron journeys, zone dwell times, marketing conversion rates |
| Visualization | Power BI + ArcGIS | Heat maps, journey animations, geofence monitoring |
🛠️ Step 1: Positioning Systems for Casino Resort Operations
Understanding the strengths and limitations of each positioning technology is critical for designing a multi-layer location system that covers both the 200-acre resort exterior and the casino floor interior.
1.1 GPS -- Outdoor Tracking
GPS is the foundation for tracking assets and patrons in outdoor areas: parking garages, valet lanes, shuttle routes, pool decks, and golf courses.
# GPS location event from a shuttle tracker
gps_event = {
    "event_id": "evt-gps-20240115-143022-001",
    "device_id": "SHUTTLE-NB-003",
    "device_type": "shuttle_tracker",
    "timestamp": "2024-01-15T14:30:22.000Z",
    "latitude": 36.1147,
    "longitude": -115.1728,
    "altitude_meters": 620.5,
    "accuracy_meters": 3.2,
    "speed_mps": 8.9,
    "heading_degrees": 275.0,
    "source_system": "gps",
    "battery_level": 87.0
}
💡 GPS Characteristics for Casino Use
- Accuracy: 3-5 meters in open sky, degrades near tall hotel towers
- Update rate: 1 Hz typical for fleet tracking, 10 Hz for precision applications
- Power draw: Moderate -- suitable for vehicle-mounted and wearable devices
- Limitation: Signals do not penetrate indoor structures; requires handoff to indoor positioning
1.2 Wi-Fi Triangulation -- Indoor Positioning
Casino resorts already deploy hundreds of Wi-Fi access points for guest connectivity. Triangulation against these APs provides room-level indoor positioning without additional hardware.
# Wi-Fi triangulated position from a patron's mobile app
wifi_event = {
    "event_id": "evt-wifi-20240115-143055-042",
    "device_id": "APP-PLY00045891",
    "device_type": "patron_app",
    "timestamp": "2024-01-15T14:30:55.000Z",
    "latitude": 36.1142,
    "longitude": -115.1735,
    "accuracy_meters": 8.0,
    "floor_level": 1,
    "indoor_zone": "SLOT_ZONE_B2",
    "source_system": "wifi_triangulation",
    "battery_level": 62.0
}
1.3 BLE Trilateration -- Precise Indoor Tracking
Bluetooth Low Energy beacons installed at known positions enable trilateration for 1-3 meter indoor accuracy. Ideal for gaming floor zone detection.
# BLE position from an employee badge
ble_event = {
    "event_id": "evt-ble-20240115-143110-088",
    "device_id": "BADGE-EMP-00234",
    "device_type": "employee_badge",
    "timestamp": "2024-01-15T14:31:10.000Z",
    "latitude": 36.1143,
    "longitude": -115.1733,
    "accuracy_meters": 1.5,
    "floor_level": 1,
    "indoor_zone": "TABLE_PIT_3",
    "source_system": "ble_trilateration",
    "battery_level": 94.0
}
1.4 Ultra-Wideband (UWB) -- Sub-Meter Accuracy
UWB provides centimeter-level accuracy for high-value asset tracking: chip trays, cash carts, and VIP patron experiences.
# UWB position from a chip tray asset tag
uwb_event = {
    "event_id": "evt-uwb-20240115-143122-005",
    "device_id": "ASSET-CHIPTRAY-0042",
    "device_type": "asset_tag",
    "timestamp": "2024-01-15T14:31:22.000Z",
    "latitude": 36.1143,
    "longitude": -115.1734,
    "accuracy_meters": 0.15,
    "floor_level": 1,
    "indoor_zone": "TABLE_PIT_3",
    "source_system": "uwb",
    "battery_level": 78.0
}
1.5 Hybrid Positioning
Production deployments combine multiple systems. A patron's mobile app might use GPS in the parking lot, switch to Wi-Fi when entering the lobby, and upgrade to BLE precision on the gaming floor.
# Hybrid position event -- system selects best available fix
hybrid_event = {
    "event_id": "evt-hyb-20240115-143200-112",
    "device_id": "APP-PLY00045891",
    "device_type": "patron_app",
    "timestamp": "2024-01-15T14:32:00.000Z",
    "latitude": 36.1142,
    "longitude": -115.1735,
    "accuracy_meters": 2.0,
    "floor_level": 1,
    "indoor_zone": "SLOT_ZONE_B2",
    "source_system": "hybrid",
    "battery_level": 61.0
}
1.6 Positioning Technology Comparison
| Technology | Accuracy | Range | Cost per Unit | Battery Impact | Best For |
|---|---|---|---|---|---|
| GPS | 3-5 m | Global (outdoor) | $15-50 | Moderate | Shuttles, valet, parking |
| Wi-Fi | 5-15 m | Building-wide | $0 (existing APs) | Low | Room-level indoor tracking |
| BLE | 1-3 m | 30-70 m per beacon | $5-25/beacon | Very Low | Gaming floor zones, POI proximity |
| UWB | 10-30 cm | 10-50 m per anchor | $50-150/anchor | Moderate | High-value asset tracking, VIP |
| Hybrid | 1-5 m | Seamless | Combined | Varies | End-to-end patron journey |
⚠️ Privacy Considerations
Location tracking requires explicit patron consent via the mobile app opt-in. All PII must be pseudonymized before analytics processing. See Tutorial 07: Governance & Purview and Tutorial 14: Security & Networking for compliance requirements.
🛠️ Step 2: Geofence Configuration
Geofences define virtual boundaries around physical zones. When a tracked device crosses a geofence boundary, the system generates entry, exit, or dwell events that drive operational workflows and marketing triggers.
2.1 Casino Resort Geofence Zones
# Geofence zone definitions for a Las Vegas casino resort
# Save as: data_generation/config/geofences.py

CASINO_GEOFENCES = [
    # ----- Gaming Floor -----
    {
        "geofence_id": "GF-MAIN-FLOOR",
        "geofence_name": "Main Casino Floor",
        "type": "polygon",
        "coordinates": [
            [36.1140, -115.1740], [36.1140, -115.1720],
            [36.1150, -115.1720], [36.1150, -115.1740]
        ],
        "floor_level": 1,
        "category": "gaming",
        "triggers": ["enter", "exit", "dwell"],
        "dwell_threshold_seconds": 300,
        "marketing_eligible": True
    },
    {
        "geofence_id": "GF-HIGH-LIMIT",
        "geofence_name": "High Limit Salon",
        "type": "circular",
        "center": [36.1145, -115.1730],
        "radius_meters": 25,
        "floor_level": 1,
        "category": "gaming_vip",
        "triggers": ["enter", "exit", "dwell"],
        "dwell_threshold_seconds": 120,
        "marketing_eligible": True
    },
    {
        "geofence_id": "GF-SPORTSBOOK",
        "geofence_name": "Sportsbook Lounge",
        "type": "polygon",
        "coordinates": [
            [36.1148, -115.1738], [36.1148, -115.1732],
            [36.1152, -115.1732], [36.1152, -115.1738]
        ],
        "floor_level": 1,
        "category": "gaming",
        "triggers": ["enter", "exit", "dwell"],
        "dwell_threshold_seconds": 600,
        "marketing_eligible": True
    },
    # ----- Hospitality -----
    {
        "geofence_id": "GF-BUFFET",
        "geofence_name": "Grand Buffet",
        "type": "circular",
        "center": [36.1143, -115.1725],
        "radius_meters": 30,
        "floor_level": 1,
        "category": "dining",
        "triggers": ["enter", "exit", "dwell"],
        "dwell_threshold_seconds": 900,
        "marketing_eligible": True
    },
    {
        "geofence_id": "GF-STEAKHOUSE",
        "geofence_name": "Prime Steakhouse",
        "type": "circular",
        "center": [36.1147, -115.1722],
        "radius_meters": 15,
        "floor_level": 1,
        "category": "dining",
        "triggers": ["enter", "dwell"],
        "dwell_threshold_seconds": 600,
        "marketing_eligible": True
    },
    # ----- Hotel -----
    {
        "geofence_id": "GF-HOTEL-LOBBY",
        "geofence_name": "Hotel Lobby",
        "type": "polygon",
        "coordinates": [
            [36.1155, -115.1735], [36.1155, -115.1725],
            [36.1160, -115.1725], [36.1160, -115.1735]
        ],
        "floor_level": 1,
        "category": "hotel",
        "triggers": ["enter", "exit"],
        "dwell_threshold_seconds": 180,
        "marketing_eligible": False
    },
    # ----- Outdoor -----
    {
        "geofence_id": "GF-POOL-DECK",
        "geofence_name": "Pool Deck & Cabanas",
        "type": "circular",
        "center": [36.1160, -115.1730],
        "radius_meters": 60,
        "floor_level": 0,
        "category": "amenity",
        "triggers": ["enter", "exit", "dwell"],
        "dwell_threshold_seconds": 1800,
        "marketing_eligible": True
    },
    {
        "geofence_id": "GF-PARKING-A",
        "geofence_name": "Parking Garage A",
        "type": "polygon",
        "coordinates": [
            [36.1130, -115.1745], [36.1130, -115.1735],
            [36.1138, -115.1735], [36.1138, -115.1745]
        ],
        "floor_level": 0,
        "category": "parking",
        "triggers": ["enter", "exit"],
        "dwell_threshold_seconds": 60,
        "marketing_eligible": False
    },
    {
        "geofence_id": "GF-VALET",
        "geofence_name": "Valet Drop-Off",
        "type": "circular",
        "center": [36.1152, -115.1740],
        "radius_meters": 20,
        "floor_level": 0,
        "category": "parking",
        "triggers": ["enter", "exit"],
        "dwell_threshold_seconds": 120,
        "marketing_eligible": False
    }
]
2.2 Geofence Types
%%{init: {'theme':'base', 'themeVariables': {'primaryColor':'#4CAF50','primaryTextColor':'#fff','primaryBorderColor':'#2E7D32','lineColor':'#43A047'}}}%%
flowchart LR
    subgraph Circular["⭕ Circular Geofence"]
        C1["Center point + radius\nSimple, fast evaluation\nBest for: POI proximity"]
    end
    subgraph Polygon["🔷 Polygon Geofence"]
        P1["Array of vertices\nArbitrary shapes\nBest for: Building footprints"]
    end
    subgraph H3Hex["⬡ H3 Hex Geofence"]
        H1["H3 index at resolution\nUniform hexagonal grid\nBest for: Spatial aggregation"]
    end

    style Circular fill:#E8F5E9
    style Polygon fill:#E3F2FD
    style H3Hex fill:#FFF3E0
2.3 Entry / Exit / Dwell Event Logic
# Geofence event evaluation logic
# This runs in the Silver layer Spark job

from shapely.geometry import Point, Polygon
from shapely.ops import nearest_points

def evaluate_geofence(lat: float, lon: float, geofences: list) -> dict:
    """
    Evaluate which geofence zone a point falls within.
    Returns geofence_id, geofence_name, and event type.
    """
    point = Point(lon, lat)  # Shapely uses (x, y) = (lon, lat)

    for fence in geofences:
        if fence["type"] == "circular":
            center = Point(fence["center"][1], fence["center"][0])
            # Approximate: 1 degree lat ~111,320 meters
            radius_deg = fence["radius_meters"] / 111320.0
            if point.distance(center) <= radius_deg:
                return {
                    "geofence_id": fence["geofence_id"],
                    "geofence_name": fence["geofence_name"],
                    "category": fence["category"]
                }

        elif fence["type"] == "polygon":
            coords = [(c[1], c[0]) for c in fence["coordinates"]]
            polygon = Polygon(coords)
            if polygon.contains(point):
                return {
                    "geofence_id": fence["geofence_id"],
                    "geofence_name": fence["geofence_name"],
                    "category": fence["category"]
                }

    return {"geofence_id": None, "geofence_name": None, "category": None}
💡 Dwell Time Tracking
Dwell events fire when a device remains inside a geofence longer than the configured
dwell_threshold_seconds. This is computed in the Silver layer by comparing the current event timestamp against the earliest entry timestamp for the same device/geofence pair within a session window.
🛠️ Step 3: H3 Spatial Indexing
Uber's H3 hexagonal hierarchical spatial index divides the earth's surface into a hierarchy of hexagonal cells. Hexagons are superior to square grids for spatial analytics because they have uniform adjacency (every neighbor shares an edge, not just a corner) and consistent distances from center to edge.
3.1 H3 Resolution Levels for Casino Scale
| Resolution | Hex Edge Length | Hex Area | Casino Use Case |
|---|---|---|---|
| 7 | ~1,220 m | ~5.16 km^2 | Regional market analysis (city-level) |
| 8 | ~461 m | ~0.74 km^2 | Resort campus footprint |
| 9 | ~174 m | ~0.105 km^2 | Building-level grouping |
| 10 | ~65 m | ~0.015 km^2 | Parking zones, outdoor areas |
| 11 | ~24 m | ~0.002 km^2 | Gaming floor sections |
| 12 | ~9 m | ~380 m^2 | Individual pit or slot bank |
For casino floor analytics, resolution 10-11 provides the best balance of granularity and aggregation performance. Use resolution 12 only for high-density areas like table pits.
3.2 H3 Indexing with PySpark
# Notebook: nb_geolocation_h3_indexing
# Compute H3 spatial indices for location events

# Install h3-pyspark in your Fabric environment
# %pip install h3-pyspark h3

import h3
from pyspark.sql.functions import udf, col, lit, struct
from pyspark.sql.types import StringType, ArrayType, DoubleType

# --- UDF: Convert lat/lon to H3 index ---
@udf(returnType=StringType())
def lat_lon_to_h3(lat, lon, resolution):
    """Convert latitude/longitude to H3 hexagonal index."""
    if lat is None or lon is None:
        return None
    try:
        return h3.latlng_to_cell(lat, lon, resolution)
    except Exception:
        return None

# --- UDF: Get H3 hex center coordinates ---
@udf(returnType=ArrayType(DoubleType()))
def h3_to_center(h3_index):
    """Get the center lat/lon of an H3 hex cell."""
    if h3_index is None:
        return None
    try:
        lat, lon = h3.cell_to_latlng(h3_index)
        return [lat, lon]
    except Exception:
        return None

# --- UDF: Get H3 hex boundary for visualization ---
@udf(returnType=ArrayType(ArrayType(DoubleType())))
def h3_to_boundary(h3_index):
    """Get the boundary vertices of an H3 hex cell."""
    if h3_index is None:
        return None
    try:
        boundary = h3.cell_to_boundary(h3_index)
        return [[lat, lon] for lat, lon in boundary]
    except Exception:
        return None

# --- Apply H3 indexing to location events ---
df_locations = spark.table("bronze_geolocation_events")

df_with_h3 = (
    df_locations
    .withColumn("h3_res10", lat_lon_to_h3(col("latitude"), col("longitude"), lit(10)))
    .withColumn("h3_res11", lat_lon_to_h3(col("latitude"), col("longitude"), lit(11)))
    .withColumn("h3_res12", lat_lon_to_h3(col("latitude"), col("longitude"), lit(12)))
)

display(df_with_h3.select(
    "event_id", "latitude", "longitude", "h3_res10", "h3_res11", "h3_res12"
).limit(10))
3.3 Spatial Aggregation with H3
# Aggregate patron density by H3 hex cell
# This drives the heat-map visualization in Power BI

from pyspark.sql.functions import count, countDistinct, avg, sum as spark_sum

patron_density = (
    df_with_h3
    .filter(col("device_type") == "patron_app")
    .filter(col("timestamp") >= "2024-01-15T00:00:00Z")
    .groupBy("h3_res10")
    .agg(
        count("event_id").alias("event_count"),
        countDistinct("device_id").alias("unique_patrons"),
        avg("accuracy_meters").alias("avg_accuracy"),
        avg("speed_mps").alias("avg_speed_mps")
    )
    .withColumn("hex_center", h3_to_center(col("h3_res10")))
    .withColumn("hex_boundary", h3_to_boundary(col("h3_res10")))
)

display(patron_density.orderBy(col("unique_patrons").desc()).limit(20))
💡 H3 Performance Tip
H3 indices are 64-bit integers stored as 15-character hex strings. They support constant-time lookups, neighbor traversal, and parent/child resolution changes. Partition your Silver Delta tables by the coarsest resolution (e.g.,
h3_res10) for optimal query pruning.
🛠️ Step 4: Real-Time Ingestion via Eventstreams
Location devices emit high-frequency telemetry that must be ingested with sub-second latency. This step configures Azure IoT Hub as the device registry and Fabric Eventstreams as the streaming pipeline.
4.1 Event Schema
The ingestion schema matches the project's geolocation_schema.json (see data_generation/schemas/analytics/geolocation_schema.json):
{
  "event_id": "evt-hyb-20240115-143200-112",
  "device_id": "APP-PLY00045891",
  "device_type": "patron_app",
  "timestamp": "2024-01-15T14:32:00.000Z",
  "latitude": 36.1142,
  "longitude": -115.1735,
  "altitude_meters": null,
  "accuracy_meters": 2.0,
  "speed_mps": 1.2,
  "heading_degrees": 180.0,
  "h3_index": null,
  "geofence_id": null,
  "geofence_name": null,
  "geofence_event": null,
  "geofence_dwell_seconds": null,
  "poi_name": null,
  "poi_distance_meters": null,
  "floor_level": 1,
  "indoor_zone": "SLOT_ZONE_B2",
  "proximity_trigger": null,
  "source_system": "hybrid",
  "battery_level": 61.0,
  "load_time": "2024-01-15T14:32:00.500Z"
}
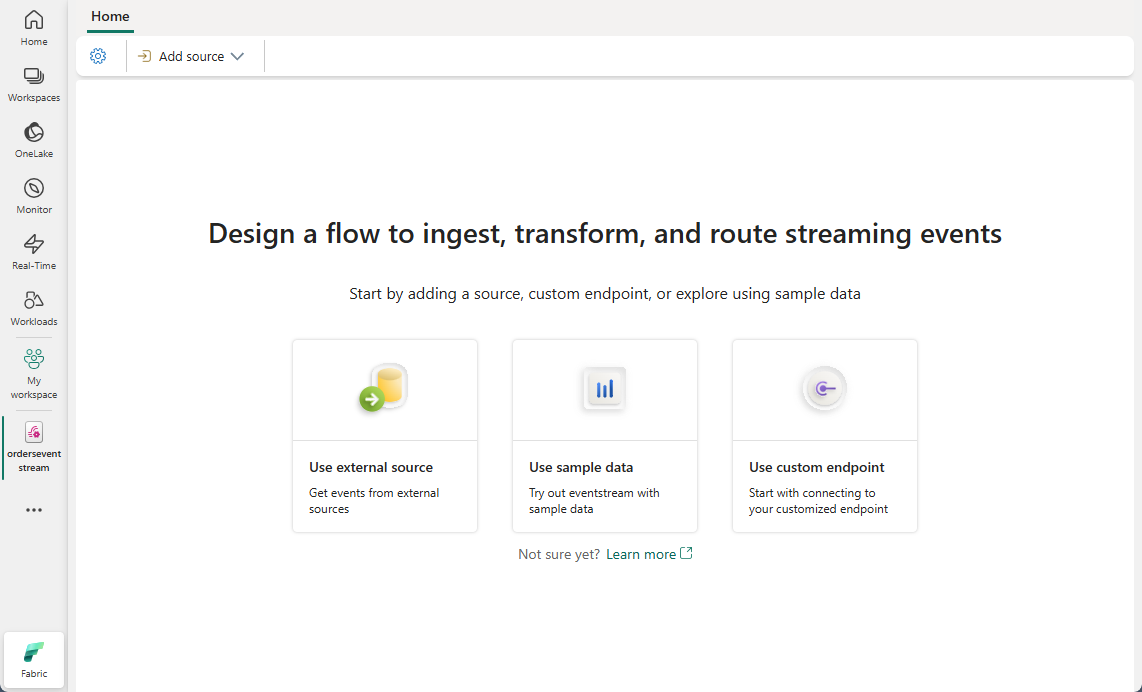
4.2 Eventstream Configuration
- In your Fabric workspace, click + New > Eventstream
- Name:
es_geolocation_events - Add source: Azure IoT Hub (or Custom App for testing)
- Add destination: Lakehouse >
lh_bronze> Table:bronze_geolocation_events
%%{init: {'theme':'base', 'themeVariables': {'primaryColor':'#FF9800','primaryTextColor':'#fff','primaryBorderColor':'#E65100','lineColor':'#FB8C00'}}}%%
flowchart LR
    A["📡 IoT Hub\n(GPS / Wi-Fi / BLE / UWB)"] --> B["⚡ Eventstream\nes_geolocation_events"]
    B --> C["🔄 Transform\n+ load_time\n+ validate coords"]
    C --> D["🥉 Lakehouse\nbronze_geolocation_events"]
    C --> E["🏠 Eventhouse\n(Real-Time KQL)"]

    style A fill:#E3F2FD
    style B fill:#FFF3E0
    style C fill:#F3E5F5
    style D fill:#E8F5E9
    style E fill:#E8F5E9
4.3 Structured Streaming Ingestion (Alternative)
For batch-micro-batch ingestion from a file-based source, use PySpark Structured Streaming:
# Notebook: nb_geolocation_stream_ingest
# Structured Streaming from IoT Hub via Event Hub-compatible endpoint

from pyspark.sql.types import (
    StructType, StructField, StringType, DoubleType,
    IntegerType, TimestampType
)
from pyspark.sql.functions import from_json, col, current_timestamp

# Schema matching geolocation_schema.json
location_schema = StructType([
    StructField("event_id", StringType(), False),
    StructField("device_id", StringType(), False),
    StructField("device_type", StringType(), False),
    StructField("timestamp", StringType(), False),
    StructField("latitude", DoubleType(), False),
    StructField("longitude", DoubleType(), False),
    StructField("altitude_meters", DoubleType(), True),
    StructField("accuracy_meters", DoubleType(), True),
    StructField("speed_mps", DoubleType(), True),
    StructField("heading_degrees", DoubleType(), True),
    StructField("h3_index", StringType(), True),
    StructField("geofence_id", StringType(), True),
    StructField("geofence_name", StringType(), True),
    StructField("geofence_event", StringType(), True),
    StructField("geofence_dwell_seconds", DoubleType(), True),
    StructField("poi_name", StringType(), True),
    StructField("poi_distance_meters", DoubleType(), True),
    StructField("floor_level", IntegerType(), True),
    StructField("indoor_zone", StringType(), True),
    StructField("proximity_trigger", StringType(), True),
    StructField("source_system", StringType(), False),
    StructField("battery_level", DoubleType(), True),
    StructField("load_time", StringType(), True)
])

# Read from Eventstream (Event Hub-compatible endpoint)
raw_stream = (
    spark.readStream
    .format("eventhubs")
    .options(**eh_conf)
    .load()
    .select(from_json(col("body").cast("string"), location_schema).alias("data"))
    .select("data.*")
    .withColumn("load_time", current_timestamp())
)

# Write to Bronze Delta table
(
    raw_stream.writeStream
    .format("delta")
    .outputMode("append")
    .option("checkpointLocation", "Files/checkpoints/geolocation_bronze")
    .toTable("bronze_geolocation_events")
)
Source: Create and manage an eventstream
🛠️ Step 5: Bronze Layer -- Raw Location Events
The Bronze layer stores all location events in their original form with minimal transformation. This preserves full fidelity for reprocessing and audit trails.
5.1 Bronze Ingestion Notebook
# Notebook: nb_bronze_geolocation
# Ingest raw geolocation events into Bronze Delta table

from pyspark.sql.functions import (
    col, lit, current_timestamp, to_timestamp,
    year, month, dayofmonth, hour
)

# Read raw events (batch mode for initial/backfill load)
raw_df = spark.read.json("Files/raw/geolocation_events/*.json")

# Minimal transformations: type casting + partition columns
bronze_df = (
    raw_df
    .withColumn("event_timestamp", to_timestamp(col("timestamp")))
    .withColumn("load_timestamp", current_timestamp())
    .withColumn("year", year(col("event_timestamp")))
    .withColumn("month", month(col("event_timestamp")))
    .withColumn("day", dayofmonth(col("event_timestamp")))
    .withColumn("hour", hour(col("event_timestamp")))
)

# Write to Bronze Delta table (partitioned by date for query performance)
(
    bronze_df.write
    .format("delta")
    .mode("append")
    .partitionBy("year", "month", "day")
    .saveAsTable("bronze_geolocation_events")
)

record_count = spark.table("bronze_geolocation_events").count()
print(f"Bronze geolocation events: {record_count:,} records")
5.2 Bronze Table Validation
# Quick validation of Bronze data quality
bronze = spark.table("bronze_geolocation_events")

# Coordinate range check
invalid_coords = bronze.filter(
    (col("latitude") < -90) | (col("latitude") > 90) |
    (col("longitude") < -180) | (col("longitude") > 180)
).count()

print(f"Invalid coordinates: {invalid_coords}")
assert invalid_coords == 0, "Found events with out-of-range coordinates"

# Device type distribution
bronze.groupBy("device_type").count().orderBy("count", ascending=False).show()

# Source system distribution
bronze.groupBy("source_system").count().orderBy("count", ascending=False).show()
🛠️ Step 6: Silver Layer -- Spatial Processing
The Silver layer enriches raw location events with H3 spatial indices, geofence evaluations, point-of-interest proximity calculations, and derived motion metrics (speed, heading). This is the most computationally intensive step and leverages PySpark with optional Apache Sedona for advanced spatial joins.
6.1 H3 Index Computation
# Notebook: nb_silver_geolocation
# Silver layer: spatial enrichment pipeline

import h3
from pyspark.sql.functions import (
    udf, col, lag, lead, lit, when, coalesce,
    unix_timestamp, sqrt, pow as spark_pow, atan2, degrees,
    broadcast
)
from pyspark.sql.types import StringType, DoubleType
from pyspark.sql.window import Window

# ---- H3 Index UDFs ----
@udf(returnType=StringType())
def compute_h3(lat, lon, res):
    if lat is None or lon is None:
        return None
    try:
        return h3.latlng_to_cell(lat, lon, res)
    except Exception:
        return None

# Read Bronze data
bronze = spark.table("bronze_geolocation_events")

# Step 1: Compute H3 indices at multiple resolutions
silver_h3 = (
    bronze
    .withColumn("h3_res9", compute_h3(col("latitude"), col("longitude"), lit(9)))
    .withColumn("h3_res10", compute_h3(col("latitude"), col("longitude"), lit(10)))
    .withColumn("h3_res11", compute_h3(col("latitude"), col("longitude"), lit(11)))
)

print("H3 indexing complete")
6.2 Geofence Intersection Checks
# Step 2: Evaluate geofence membership using broadcast join
# Load geofence definitions as a Spark DataFrame

from shapely.geometry import Point, Polygon

geofence_data = [
    ("GF-MAIN-FLOOR", "Main Casino Floor", "polygon",
     [[36.1140,-115.1740],[36.1140,-115.1720],[36.1150,-115.1720],[36.1150,-115.1740]],
     None, None, "gaming"),
    ("GF-HIGH-LIMIT", "High Limit Salon", "circular",
     None, [36.1145, -115.1730], 25.0, "gaming_vip"),
    ("GF-SPORTSBOOK", "Sportsbook Lounge", "polygon",
     [[36.1148,-115.1738],[36.1148,-115.1732],[36.1152,-115.1732],[36.1152,-115.1738]],
     None, None, "gaming"),
    ("GF-BUFFET", "Grand Buffet", "circular",
     None, [36.1143, -115.1725], 30.0, "dining"),
    ("GF-POOL-DECK", "Pool Deck & Cabanas", "circular",
     None, [36.1160, -115.1730], 60.0, "amenity"),
    ("GF-PARKING-A", "Parking Garage A", "polygon",
     [[36.1130,-115.1745],[36.1130,-115.1735],[36.1138,-115.1735],[36.1138,-115.1745]],
     None, None, "parking"),
]

@udf(returnType=StringType())
def match_geofence_id(lat, lon):
    """Match a coordinate to the first containing geofence."""
    if lat is None or lon is None:
        return None
    point = Point(lon, lat)
    for gf in geofence_data:
        gf_id, _, gf_type, coords, center, radius, _ = gf
        if gf_type == "circular" and center and radius:
            center_pt = Point(center[1], center[0])
            if point.distance(center_pt) <= radius / 111320.0:
                return gf_id
        elif gf_type == "polygon" and coords:
            poly = Polygon([(c[1], c[0]) for c in coords])
            if poly.contains(point):
                return gf_id
    return None

@udf(returnType=StringType())
def match_geofence_name(lat, lon):
    """Return the name of the matched geofence."""
    if lat is None or lon is None:
        return None
    point = Point(lon, lat)
    for gf in geofence_data:
        _, gf_name, gf_type, coords, center, radius, _ = gf
        if gf_type == "circular" and center and radius:
            center_pt = Point(center[1], center[0])
            if point.distance(center_pt) <= radius / 111320.0:
                return gf_name
        elif gf_type == "polygon" and coords:
            poly = Polygon([(c[1], c[0]) for c in coords])
            if poly.contains(point):
                return gf_name
    return None

# Apply geofence matching
silver_geo = (
    silver_h3
    .withColumn("matched_geofence_id", match_geofence_id(col("latitude"), col("longitude")))
    .withColumn("matched_geofence_name", match_geofence_name(col("latitude"), col("longitude")))
)

print("Geofence matching complete")
6.3 Point-of-Interest Proximity Calculation
# Step 3: Calculate distance to nearest POI

POI_LIST = [
    ("POI-SLOTS-A", "Slot Zone A", 36.1142, -115.1733),
    ("POI-SLOTS-B", "Slot Zone B", 36.1144, -115.1728),
    ("POI-TABLE-PIT-1", "Table Pit 1", 36.1146, -115.1731),
    ("POI-TABLE-PIT-2", "Table Pit 2", 36.1148, -115.1729),
    ("POI-CASHIER", "Main Cashier", 36.1141, -115.1726),
    ("POI-BAR-CENTER", "Center Bar", 36.1145, -115.1730),
    ("POI-BUFFET-ENTRANCE", "Buffet Entrance", 36.1143, -115.1724),
    ("POI-STEAKHOUSE", "Prime Steakhouse", 36.1147, -115.1722),
    ("POI-VIP-LOUNGE", "VIP Lounge", 36.1149, -115.1735),
    ("POI-SPORTSBOOK", "Sportsbook Window", 36.1150, -115.1736),
]

@udf(returnType=StringType())
def nearest_poi_name(lat, lon):
    """Find the name of the nearest POI."""
    if lat is None or lon is None:
        return None
    min_dist = float("inf")
    nearest = None
    for _, name, plat, plon in POI_LIST:
        dist = ((lat - plat)**2 + (lon - plon)**2) ** 0.5
        if dist < min_dist:
            min_dist = dist
            nearest = name
    return nearest

@udf(returnType=DoubleType())
def nearest_poi_distance(lat, lon):
    """Calculate distance in meters to nearest POI."""
    if lat is None or lon is None:
        return None
    min_dist = float("inf")
    for _, _, plat, plon in POI_LIST:
        dlat = (lat - plat) * 111320
        dlon = (lon - plon) * 111320 * 0.833  # cos(36 deg) approx
        dist = (dlat**2 + dlon**2) ** 0.5
        if dist < min_dist:
            min_dist = dist
    return round(min_dist, 2)

silver_poi = (
    silver_geo
    .withColumn("nearest_poi", nearest_poi_name(col("latitude"), col("longitude")))
    .withColumn("poi_dist_meters", nearest_poi_distance(col("latitude"), col("longitude")))
)
6.4 Speed and Heading Derivation
# Step 4: Derive speed and heading from consecutive location fixes

device_window = Window.partitionBy("device_id").orderBy("event_timestamp")

silver_motion = (
    silver_poi
    .withColumn("prev_lat", lag("latitude", 1).over(device_window))
    .withColumn("prev_lon", lag("longitude", 1).over(device_window))
    .withColumn("prev_ts", lag("event_timestamp", 1).over(device_window))
    .withColumn(
        "time_delta_sec",
        unix_timestamp(col("event_timestamp")) - unix_timestamp(col("prev_ts"))
    )
    .withColumn(
        "distance_meters",
        when(
            col("prev_lat").isNotNull(),
            sqrt(
                spark_pow((col("latitude") - col("prev_lat")) * 111320, 2) +
                spark_pow((col("longitude") - col("prev_lon")) * 111320 * 0.833, 2)
            )
        )
    )
    .withColumn(
        "derived_speed_mps",
        when(
            (col("time_delta_sec") > 0) & (col("distance_meters").isNotNull()),
            col("distance_meters") / col("time_delta_sec")
        )
    )
    .withColumn(
        "derived_heading_deg",
        when(
            col("prev_lat").isNotNull(),
            degrees(atan2(
                col("longitude") - col("prev_lon"),
                col("latitude") - col("prev_lat")
            ))
        )
    )
    .drop("prev_lat", "prev_lon", "prev_ts")
)
6.5 Apache Sedona Spatial Joins (Optional)
For complex spatial operations such as polygon-to-polygon intersections or buffer queries, Apache Sedona provides optimized distributed spatial joins.
# Optional: Apache Sedona for advanced spatial joins
# %pip install apache-sedona

from sedona.spark import SedonaContext

sedona = SedonaContext.create(spark)

# Register location data as spatial DataFrame
sedona.sql("""
    CREATE OR REPLACE TEMP VIEW location_points AS
    SELECT *,
           ST_Point(CAST(longitude AS DECIMAL(10,6)),
                    CAST(latitude AS DECIMAL(10,6))) AS geom
    FROM silver_geolocation
""")

# Register geofence polygons
sedona.sql("""
    CREATE OR REPLACE TEMP VIEW geofence_polygons AS
    SELECT geofence_id, geofence_name, category,
           ST_GeomFromWKT(wkt_geometry) AS geom
    FROM geofence_definitions
""")

# Spatial join: find all points within each geofence
spatial_join_result = sedona.sql("""
    SELECT l.event_id, l.device_id, l.timestamp,
           g.geofence_id, g.geofence_name, g.category
    FROM location_points l
    JOIN geofence_polygons g
    ON ST_Contains(g.geom, l.geom)
""")

display(spatial_join_result.limit(20))
6.6 Write Silver Table
# Write enriched data to Silver layer
final_silver = (
    silver_motion
    .select(
        "event_id", "device_id", "device_type", "event_timestamp",
        "latitude", "longitude", "accuracy_meters",
        "h3_res9", "h3_res10", "h3_res11",
        "matched_geofence_id", "matched_geofence_name",
        "nearest_poi", "poi_dist_meters",
        "speed_mps", "derived_speed_mps", "heading_degrees", "derived_heading_deg",
        "floor_level", "indoor_zone", "source_system",
        "battery_level", "load_timestamp",
        "distance_meters", "time_delta_sec",
        "year", "month", "day"
    )
)

(
    final_silver.write
    .format("delta")
    .mode("overwrite")
    .partitionBy("year", "month")
    .saveAsTable("silver_geolocation_events")
)

print(f"Silver geolocation events: {final_silver.count():,} records")
🛠️ Step 7: Gold Layer -- Location Intelligence
The Gold layer transforms enriched location data into business-ready analytics: patron journey maps, zone dwell time aggregations, route popularity rankings, proximity marketing conversion metrics, and revenue attribution by geofence zone.
7.1 Patron Journey Mapping
# Notebook: nb_gold_geolocation
# Build patron journey sequences from Silver location events

from pyspark.sql.functions import (
    collect_list, struct, col, count, countDistinct,
    min as spark_min, max as spark_max, sum as spark_sum,
    avg, round as spark_round, datediff, when
)
from pyspark.sql.window import Window

silver = spark.table("silver_geolocation_events")

# Build ordered zone sequence per patron per day
journey_window = Window.partitionBy("device_id", "year", "month", "day").orderBy("event_timestamp")

patron_journeys = (
    silver
    .filter(col("device_type") == "patron_app")
    .filter(col("matched_geofence_name").isNotNull())
    .withColumn("zone_sequence_num", F.row_number().over(journey_window))
    .groupBy("device_id", "year", "month", "day")
    .agg(
        collect_list(
            struct("event_timestamp", "matched_geofence_name", "nearest_poi")
        ).alias("journey_steps"),
        countDistinct("matched_geofence_id").alias("zones_visited"),
        spark_min("event_timestamp").alias("journey_start"),
        spark_max("event_timestamp").alias("journey_end"),
        count("event_id").alias("total_location_pings")
    )
    .withColumn(
        "journey_duration_min",
        spark_round(
            (unix_timestamp(col("journey_end")) - unix_timestamp(col("journey_start"))) / 60, 1
        )
    )
)

(
    patron_journeys.write
    .format("delta")
    .mode("overwrite")
    .saveAsTable("gold_patron_journeys")
)

display(patron_journeys.orderBy(col("zones_visited").desc()).limit(10))
7.2 Zone Dwell Time Analysis
# Aggregate dwell time by geofence zone
# A "dwell session" is a continuous period where a device stays in one zone

from pyspark.sql import functions as F

zone_dwell = (
    silver
    .filter(col("device_type") == "patron_app")
    .filter(col("matched_geofence_name").isNotNull())
    .groupBy("matched_geofence_id", "matched_geofence_name", "year", "month", "day")
    .agg(
        countDistinct("device_id").alias("unique_patrons"),
        count("event_id").alias("total_events"),
        spark_round(avg("time_delta_sec"), 1).alias("avg_ping_interval_sec"),
        # Approximate total dwell = sum of time deltas where device is in zone
        spark_round(spark_sum("time_delta_sec") / 60, 1).alias("total_dwell_minutes"),
        spark_round(avg("poi_dist_meters"), 1).alias("avg_poi_distance_m")
    )
    .withColumn(
        "avg_dwell_per_patron_min",
        spark_round(col("total_dwell_minutes") / col("unique_patrons"), 1)
    )
)

(
    zone_dwell.write
    .format("delta")
    .mode("overwrite")
    .saveAsTable("gold_zone_dwell_time")
)

display(zone_dwell.orderBy(col("unique_patrons").desc()))
7.3 Popular Route Analysis
# Identify the most common zone-to-zone transitions
from pyspark.sql.functions import lead

route_window = Window.partitionBy("device_id", "year", "month", "day").orderBy("event_timestamp")

zone_transitions = (
    silver
    .filter(col("device_type") == "patron_app")
    .filter(col("matched_geofence_name").isNotNull())
    .withColumn("next_zone", lead("matched_geofence_name", 1).over(route_window))
    .filter(col("next_zone").isNotNull())
    .filter(col("matched_geofence_name") != col("next_zone"))  # Only transitions
    .groupBy("matched_geofence_name", "next_zone")
    .agg(
        count("event_id").alias("transition_count"),
        countDistinct("device_id").alias("unique_patrons")
    )
    .withColumnRenamed("matched_geofence_name", "from_zone")
    .withColumnRenamed("next_zone", "to_zone")
    .orderBy(col("transition_count").desc())
)

(
    zone_transitions.write
    .format("delta")
    .mode("overwrite")
    .saveAsTable("gold_zone_transitions")
)

display(zone_transitions.limit(20))
7.4 Proximity Marketing Metrics
# Track proximity-triggered marketing events and conversion rates
proximity_marketing = (
    silver
    .filter(col("device_type") == "patron_app")
    .filter(col("nearest_poi").isNotNull())
    .filter(col("poi_dist_meters") <= 15.0)  # Within 15 meters of POI
    .groupBy("nearest_poi", "year", "month", "day")
    .agg(
        countDistinct("device_id").alias("patrons_in_proximity"),
        count("event_id").alias("proximity_events"),
        spark_round(avg("poi_dist_meters"), 1).alias("avg_distance_m")
    )
)

(
    proximity_marketing.write
    .format("delta")
    .mode("overwrite")
    .saveAsTable("gold_proximity_marketing")
)
7.5 Revenue Attribution by Location (Join with Gaming Data)
# Join location data with gaming revenue for zone-level revenue attribution
# Requires gold_slot_performance or similar table from Tutorial 03

gaming_revenue = spark.table("gold_slot_performance")

zone_revenue = (
    silver
    .filter(col("device_type") == "patron_app")
    .filter(col("matched_geofence_name").isNotNull())
    .select("device_id", "matched_geofence_name", "event_timestamp", "year", "month", "day")
    .join(
        gaming_revenue.select("player_id", "total_coin_in", "net_win", "session_date"),
        (col("device_id") == col("player_id")) &
        (col("day") == col("session_date")),
        "inner"
    )
    .groupBy("matched_geofence_name", "year", "month")
    .agg(
        spark_sum("total_coin_in").alias("attributed_coin_in"),
        spark_sum("net_win").alias("attributed_net_win"),
        countDistinct("device_id").alias("attributed_patrons")
    )
)

(
    zone_revenue.write
    .format("delta")
    .mode("overwrite")
    .saveAsTable("gold_zone_revenue_attribution")
)
7.6 DAX Measures for Location Intelligence
// ---- Power BI DAX Measures for Geolocation Analytics ----

// Unique patrons in selected zone
Unique Patrons in Zone =
DISTINCTCOUNT(gold_zone_dwell_time[unique_patrons])

// Average dwell time per patron
Avg Dwell Time (min) =
AVERAGE(gold_zone_dwell_time[avg_dwell_per_patron_min])

// Proximity marketing conversion rate
// (patrons who visited POI after receiving proximity push / total pushes)
Proximity Conversion Rate =
DIVIDE(
    CALCULATE(
        DISTINCTCOUNT(gold_proximity_marketing[patrons_in_proximity]),
        gold_proximity_marketing[avg_distance_m] <= 5
    ),
    DISTINCTCOUNT(gold_proximity_marketing[patrons_in_proximity]),
    0
)

// Revenue per square meter (using H3 hex area)
Revenue per Hex Cell =
DIVIDE(
    SUM(gold_zone_revenue_attribution[attributed_coin_in]),
    DISTINCTCOUNT(silver_geolocation_events[h3_res11]),
    0
)

// Zone transition popularity score
Transition Score =
DIVIDE(
    SUM(gold_zone_transitions[transition_count]),
    CALCULATE(
        SUM(gold_zone_transitions[transition_count]),
        ALL(gold_zone_transitions[from_zone])
    ),
    0
)

// Hot zone indicator (above-average patron density)
Is Hot Zone =
VAR CurrentPatrons = SUM(gold_zone_dwell_time[unique_patrons])
VAR AvgPatrons = AVERAGE(gold_zone_dwell_time[unique_patrons])
RETURN
    IF(CurrentPatrons > AvgPatrons * 1.5, "Hot", "Normal")
🛠️ Step 8: Geospatial Visualization
8.1 Power BI Map Visuals
Configure Power BI with Direct Lake connection to visualize geolocation data on interactive maps.
- Open Power BI Desktop and connect to your Fabric Lakehouse via Direct Lake
- Add an Azure Map Visual:
- Drag
latitudeto Latitude - Drag
longitudeto Longitude - Drag
unique_patronsto Size - Drag
matched_geofence_nameto Legend

Source: Azure Maps Power BI visual
8.2 H3 Hex Grid Overlay
Visualize patron density using H3 hexagonal grid cells for uniform spatial aggregation.
# Generate GeoJSON for H3 hex grid visualization
import json
import h3

def h3_hex_to_geojson(h3_density_df):
    """Convert H3 density DataFrame to GeoJSON FeatureCollection."""
    features = []
    for row in h3_density_df.collect():
        h3_idx = row["h3_res10"]
        boundary = h3.cell_to_boundary(h3_idx)
        # GeoJSON uses [lon, lat] order and requires closed ring
        coords = [[lon, lat] for lat, lon in boundary]
        coords.append(coords[0])  # Close the polygon

        feature = {
            "type": "Feature",
            "geometry": {
                "type": "Polygon",
                "coordinates": [coords]
            },
            "properties": {
                "h3_index": h3_idx,
                "event_count": row["event_count"],
                "unique_patrons": row["unique_patrons"],
                "avg_speed": row["avg_speed_mps"]
            }
        }
        features.append(feature)

    return {"type": "FeatureCollection", "features": features}

# Create and save GeoJSON
density_df = spark.table("gold_zone_dwell_time")
# (Use the patron_density DataFrame from Step 3.3 for H3-level data)
# geojson = h3_hex_to_geojson(patron_density)
# Save to Files for Power BI Shape Map or custom visual
8.3 Patron Journey Animation
Build a time-series animation showing patron movement through casino zones over the course of a visit.
// Patron journey path -- use with Power BI Play Axis or Scatter Chart animation
Journey Sequence =
RANKX(
    FILTER(
        gold_patron_journeys,
        gold_patron_journeys[device_id] = SELECTEDVALUE(gold_patron_journeys[device_id])
    ),
    gold_patron_journeys[journey_start],
    ,
    ASC,
    Dense
)
Dashboard Configuration: - Use a Scatter Chart with latitude/longitude on axes and a Play Axis slicer on timestamp - Color by matched_geofence_name to show zone transitions - Size by dwell_time_min to emphasize where patrons spend the most time
8.4 Geofence Monitoring Dashboard Layout
┌─────────────────────────────────────────────────────────────────────────┐
│  📍 GEOLOCATION ANALYTICS DASHBOARD              🔄 Auto-refresh: 30s  │
├──────────────┬──────────────┬──────────────┬───────────────────────────┤
│   👥          │   📍          │   ⏱️          │   🎯                      │
│   1,247      │   9           │   42 min     │   87                     │
│  Active      │  Zones       │  Avg Dwell   │  Proximity               │
│  Patrons     │  Occupied    │  Time        │  Triggers                │
├──────────────┴──────────────┴──────────────┴───────────────────────────┤
│              🗺️ CASINO FLOOR MAP (H3 Heat Grid)                        │
│  ┌─────────────────────────────────────────────────────────────────┐   │
│  │  ⬡ ⬡ ⬡ ⬡ ⬡    [H3 hex cells colored by patron density]       │   │
│  │  ⬡ ⬡ ⬡ ⬡ ⬡    Red = High density | Blue = Low density        │   │
│  │  ⬡ ⬡ ⬡ ⬡ ⬡    Click hex for zone details                     │   │
│  └─────────────────────────────────────────────────────────────────┘   │
├──────────────────────────────────┬──────────────────────────────────────┤
│  🔄 TOP ZONE TRANSITIONS         │  📊 DWELL TIME BY ZONE               │
│  ┌────────────┬─────────┬─────┐  │  Main Floor    ████████████ 45 min  │
│  │ From       │ To      │  #  │  │  Sportsbook    ████████ 32 min      │
│  ├────────────┼─────────┼─────┤  │  Buffet        ███████ 28 min       │
│  │ Parking A  │ Lobby   │ 342 │  │  High Limit    ██████ 24 min        │
│  │ Lobby      │ Floor   │ 298 │  │  Pool Deck     ████ 18 min          │
│  │ Floor      │ Buffet  │ 187 │  │  Bar           ███ 12 min           │
│  │ Sportsbook │ Bar     │ 156 │  │  Steakhouse    ██ 8 min             │
│  └────────────┴─────────┴─────┘  │  Lobby         █ 3 min              │
└──────────────────────────────────┴──────────────────────────────────────┘
8.5 ArcGIS GeoAnalytics Integration
For advanced spatial analysis beyond what Power BI map visuals offer, integrate with ArcGIS GeoAnalytics Engine. This is covered in detail in Tutorial 21: GeoAnalytics & ArcGIS.
Key ArcGIS capabilities that complement this tutorial:
| Capability | Use Case |
|---|---|
| Hot Spot Analysis (Getis-Ord Gi*) | Statistically significant clusters of high/low patron activity |
| Space-Time Pattern Mining | Detect emerging trends in patron movement over weeks |
| Network Analysis (Drive Time) | Calculate shuttle route optimization |
| Viewshed Analysis | Verify security camera coverage against patron density |
| Hexbin Aggregation | Alternative to H3 using Esri's built-in hex binning |
# Bridge to ArcGIS: Export Silver data for ArcGIS GeoAnalytics
from arcgis.features import GeoAccessor

silver_pdf = spark.table("silver_geolocation_events").limit(100000).toPandas()
silver_sdf = GeoAccessor.from_xy(silver_pdf, "longitude", "latitude")

# Publish as hosted Feature Layer for ArcGIS analysis
layer = silver_sdf.spatial.to_featurelayer(
    title="Casino Patron Locations - Fabric Silver",
    gis=gis,
    folder="Fabric Geolocation"
)
print(f"Published to ArcGIS: {layer.url}")
🔧 Troubleshooting
| Symptom | Likely Cause | Solution |
|---|---|---|
H3 UDF returns None for valid coordinates | h3 library not installed in Spark environment | Run %pip install h3 in notebook, restart session |
GPS coordinates cluster at (0, 0) | Device sending default coords when no GPS fix | Filter out (0, 0) in Bronze validation; check device firmware |
| Indoor positions jump erratically | Wi-Fi triangulation multipath interference | Apply Kalman filter smoothing; increase BLE beacon density |
| Geofence events not firing | Geofence polygon winding order incorrect | Ensure counter-clockwise vertex ordering for Shapely |
| Dwell time calculation shows 0 for all zones | time_delta_sec is NULL due to single-event devices | Require minimum 2 events per device per session in Silver filter |
| H3 aggregation too coarse | Using resolution 7-8 for indoor analytics | Increase to resolution 11-12 for floor-level granularity |
| Eventstream high latency (> 5s) | IoT Hub partition count too low | Scale IoT Hub to S2/S3 tier; increase partition count to 32+ |
| Power BI map visual blank | Latitude/longitude columns not recognized | Ensure column data types are Decimal Number; set data category to Latitude/Longitude |
| Apache Sedona spatial join fails | Geometry column not registered | Verify ST_Point / ST_GeomFromWKT syntax; check Sedona version compatibility |
| Battery drain on patron devices | GPS polling frequency too high | Reduce GPS to 0.1 Hz outdoors; rely on BLE/Wi-Fi indoors |
📋 Best Practices
-
Layer your positioning systems: Use GPS for outdoor, Wi-Fi for coarse indoor, BLE for zone-level, and UWB only where sub-meter accuracy justifies the cost. Never rely on a single technology.
-
Choose H3 resolution carefully: Resolution 10 (65m edge) covers parking areas efficiently; resolution 11 (24m edge) maps well to gaming floor sections; resolution 12 (9m edge) isolates individual table pits. Using too-fine resolution wastes storage and slows aggregation.
-
Partition Delta tables by time: Geolocation data grows fast (50,000+ events/hour per resort). Partition Bronze and Silver by
year/month/dayand Gold byyear/monthfor efficient time-range pruning. -
Apply coordinate validation early: Filter out
(0, 0), out-of-range coordinates, and accuracy_meters > 100 in the Bronze-to-Silver transition. Bad coordinates propagate through every downstream calculation. -
Smooth noisy indoor positions: Wi-Fi triangulation produces jittery coordinates. Apply exponential moving average or Kalman filtering in the Silver layer to reduce false geofence transitions.
-
Respect patron privacy: Hash or pseudonymize
device_idvalues in Gold tables. Enforce row-level security so only authorized roles can see individual patron journeys. Store raw PII only in Bronze with restricted access. -
Broadcast small lookup tables: Geofence definitions, POI lists, and zone mappings are small datasets. Use
broadcast()joins in PySpark to avoid expensive shuffle operations. -
Monitor battery levels: Track
battery_leveltrends per device type. Devices below 20% produce unreliable location fixes. Alert operations when fleet battery levels drop. -
Use H3 for cross-dataset joins: H3 indices provide a universal spatial key. Join geolocation events with gaming transactions, F&B orders, and loyalty check-ins using the same H3 resolution for consistent spatial attribution.
-
Test geofences with known positions: Before production deployment, walk test routes with a logging device and verify that geofence enter/exit events fire at the correct physical boundaries. Adjust polygon vertices and circular radii based on ground truth.
✅ Summary
Congratulations! You have built a complete geolocation analytics pipeline for casino resort operations in Microsoft Fabric.
What You Accomplished
- ✅ Evaluated four positioning technologies (GPS, Wi-Fi, BLE, UWB) and their casino use cases
- ✅ Defined geofence zones with circular, polygon, and hexagonal boundaries
- ✅ Implemented Uber H3 spatial indexing at resolutions 9-12 for multi-scale aggregation
- ✅ Ingested real-time location events through Eventstreams into Bronze Delta tables
- ✅ Built Silver layer spatial processing with H3, geofence evaluation, POI proximity, and motion derivation
- ✅ Created Gold layer location intelligence including patron journeys, dwell time analysis, route popularity, and revenue attribution
- ✅ Developed DAX measures for proximity marketing conversion and zone profitability
- ✅ Designed geospatial dashboards with H3 hex grids and patron journey visualizations
- ✅ Connected to ArcGIS GeoAnalytics Engine for advanced spatial analysis
Key Takeaways
| Concept | Key Point |
|---|---|
| H3 Spatial Index | Hexagonal hierarchy provides uniform aggregation and constant-time lookups for geospatial analytics |
| Geofencing | Virtual boundaries transform raw coordinates into business events (entry, exit, dwell) |
| Hybrid Positioning | Combining GPS/Wi-Fi/BLE/UWB delivers seamless indoor-outdoor tracking |
| Location Intelligence | Patron journey mapping and zone revenue attribution drive marketing and operations decisions |
| Privacy by Design | Pseudonymize PII, enforce RLS, and require explicit opt-in for location tracking |
🚀 Next Steps
Continue your learning journey:
Next Tutorial: Tutorial 30: Tribal Healthcare Analytics -- Build healthcare analytics pipelines for tribal gaming operations including IHS integration, HIPAA compliance, and clinical data quality frameworks.
Related Tutorials: - Tutorial 21: GeoAnalytics & ArcGIS -- Advanced ArcGIS GeoAnalytics Engine integration for hot spot analysis and network routing - Tutorial 28: People Movement Analytics -- Computer vision-based occupancy counting and flow analysis - Tutorial 04: Real-Time Analytics -- Eventstreams and Eventhouse fundamentals
📚 Resources
| Resource | Link |
|---|---|
| Uber H3 Documentation | h3geo.org |
| Apache Sedona (GeoSpark) | sedona.apache.org |
| Azure Maps Power BI Visual | Microsoft Learn |
| Fabric Eventstreams | Microsoft Learn |
| Fabric Lakehouse Overview | Microsoft Learn |
| ArcGIS for Microsoft Fabric | esri.com |
| Azure IoT Hub Documentation | Microsoft Learn |
| Geolocation Schema Reference | data_generation/schemas/analytics/geolocation_schema.json |
🧭 Navigation
| Previous | Up | Next |
|---|---|---|
| ⬅️ 28-People Movement Analytics | 📖 Tutorials Index | 30-Tribal Healthcare Analytics ➡️ |
Questions or issues? Open an issue in the GitHub repository
Tutorial 29 of 31 in the Microsoft Fabric Casino POC Series