Home > POC Agenda > Demo Runbook
🎰 Casino/Gaming Microsoft Fabric POC - Demo Runbook
Last Updated: 2026-04-15 | Version: 2.0 Status: ✅ Final | Maintainer: Documentation Team
Presenter Guide for Live Demonstrations
Duration: 90 minutes
Third-party references — publicly sourced, good-faith comparison
This page references non-Microsoft products and services. That information is drawn from each vendor's publicly available documentation and is offered for honest, good-faith comparison only. This is a personal project written from a Microsoft Fabric and Azure perspective; it does not claim expertise in, or authority over, any third-party product, and nothing here is an official statement by, or endorsed by, those vendors. Capabilities, pricing, and features change often — always verify against the vendor's current official documentation. Where a third-party offering is the stronger choice, we say so plainly.
📋 Table of Contents
- 1. Pre-Demo Checklist
- 2. Demo Flow Overview (90-minute version)
- 3. Demo Sections
- A. Opening (5 min)
- B. Medallion Architecture Demo (25 min)
- C. Real-Time Intelligence Demo (20 min)
- D. Power BI & Direct Lake Demo (20 min)
- E. Governance with Purview Demo (15 min)
- F. Wrap-up & Q&A (5 min)
- 4. Troubleshooting Quick Reference
- 5. Backup Demo Paths
- 6. Appendix
✅ 1. Pre-Demo Checklist
1.1 Environment Verification (30 minutes before demo)
| Check | Action | Status |
|---|---|---|
| Azure Portal - Verify subscription access | [ ] | |
| Fabric Portal - Login to app.fabric.microsoft.com | [ ] | |
| Capacity - Confirm F64 is running and assigned | [ ] | |
Workspace - Open casino-fabric-poc workspace | [ ] | |
| Purview - Verify access to purview.microsoft.com | [ ] |
1.2 Data Verification
| Check | Expected | Status |
|---|---|---|
| Bronze tables populated (6 tables) | [ ] | |
| Silver tables populated (6 tables) | [ ] | |
| Gold tables populated (6 tables) | [ ] | |
| Eventhouse receiving data | [ ] | |
| Power BI reports loading | [ ] |
Quick Validation Queries:
-- Run in lh_bronze SQL endpoint
SELECT 'bronze_slot_telemetry' as table_name, COUNT(*) as row_count FROM bronze_slot_telemetry
UNION ALL
SELECT 'bronze_player_profile', COUNT(*) FROM bronze_player_profile
UNION ALL
SELECT 'bronze_financial_txn', COUNT(*) FROM bronze_financial_txn;
1.3 Browser Tabs to Have Open
Open these tabs in order (left to right):
| Tab # | URL | Purpose |
|---|---|---|
| 1 | app.fabric.microsoft.com | Fabric Portal - Workspace |
| 2 | app.fabric.microsoft.com | Fabric Portal - Bronze Lakehouse |
| 3 | app.fabric.microsoft.com | Fabric Portal - Eventhouse |
| 4 | app.powerbi.com | Power BI - Executive Dashboard |
| 5 | purview.microsoft.com | Purview Portal |
| 6 | Architecture slide (local) | Opening presentation |
1.4 Pre-Demo Setup Actions
| Time Before | Action |
|---|---|
| 60 min | Run data generator to ensure fresh data |
| 30 min | Start streaming producer for real-time demo |
| 15 min | Clear browser cache, close unnecessary tabs |
| 10 min | Test screen sharing / projector |
| 5 min | Open all browser tabs in correct order |
| 2 min | Minimize notifications, enable Do Not Disturb |
1.5 Backup Plans for Common Issues
| Issue | Backup Plan |
|---|---|
| No Fabric capacity | Use screenshots + architecture diagrams |
| Streaming not working | Show pre-recorded KQL queries with cached data |
| Power BI slow | Have PDF export of key reports |
| Purview unavailable | Use lineage diagram from architecture docs |
| Network issues | Have local copies of notebooks and screenshots |
🎬 2. Demo Flow Overview (90-minute version)
+-----+------------------+------------------+---------------------+------------------+-----------+-----+
| 0   | 5                | 30               | 50                  | 70               | 85        | 90  |
+-----+------------------+------------------+---------------------+------------------+-----------+-----+
|  A  |       B          |        C         |         D           |        E         |     F     |
|     |                  |                  |                     |                  |           |
|OPEN | MEDALLION ARCH   | REAL-TIME        | POWER BI &          | PURVIEW          | WRAP-UP   |
|     | Bronze/Silver/   | Eventhouse       | DIRECT LAKE         | GOVERNANCE       | Q&A       |
|     | Gold Demo        | Streaming Demo   | Dashboards          | Lineage          |           |
+-----+------------------+------------------+---------------------+------------------+-----------+-----+
  5m         25m                20m                  20m                  15m             5m
Timing Summary
| Section | Duration | Cumulative |
|---|---|---|
| A. Opening | 5 min | 5 min |
| B. Medallion Architecture | 25 min | 30 min |
| C. Real-Time Intelligence | 20 min | 50 min |
| D. Power BI & Direct Lake | 20 min | 70 min |
| E. Purview Governance | 15 min | 85 min |
| F. Wrap-up & Q&A | 5 min | 90 min |
🎯 3. Demo Sections
A. Opening (5 min)
Objective: Set context, establish credibility, outline what attendees will see.
A.1 Welcome and Context Setting (2 min)
[Show: Architecture slide or README in GitHub]
Talking Points:
"Welcome to the Microsoft Fabric Casino & Gaming POC demonstration. Today, we'll walk through a complete end-to-end analytics platform purpose-built for the gaming industry.
This isn't just a toy demo - what you'll see represents patterns you can deploy in production to address real challenges: - Real-time floor monitoring - Regulatory compliance (NIGC MICS, FinCEN) - Player analytics and churn prevention - Sub-second business intelligence"
A.2 Architecture Overview (2 min)
[Show: Architecture diagram from README or ARCHITECTURE.md]
Navigation: 1. Open browser Tab 1 (Fabric Portal) 2. Navigate to: Workspace > Show workspace overview
Talking Points:
"Let me show you the architecture we've built:
Data flows from left to right: - Casino floor systems (slot machines, table games, player cards) - Through our Medallion architecture (Bronze for raw, Silver for cleansed, Gold for business-ready) - Into two consumption paths: batch analytics via Direct Lake Power BI, and real-time via Eventhouse - All governed through Microsoft Purview
The beauty of Fabric is that all of this lives in ONE platform - no data movement between services."
[Screenshot: Architecture Overview]
┌─────────────────────────────────────────────────────────────────┐
│                                                                 │
│   [Place screenshot of workspace overview here]                 │
│                                                                 │
└─────────────────────────────────────────────────────────────────┘
A.3 POC Objectives (1 min)
Talking Points:
"By the end of this demonstration, you'll see: 1. How the Medallion architecture transforms raw casino data into business insights 2. Real-time slot floor monitoring with sub-second latency 3. Executive dashboards powered by Direct Lake - no data refresh needed 4. Complete data lineage and governance through Purview
Let's dive in."
Transition:
"We'll start where all good data platforms start - with the data. Let me show you the Medallion architecture in action."
B. Medallion Architecture Demo (25 min)
Objective: Demonstrate the Bronze/Silver/Gold pattern with real casino data.
B.1 Bronze Layer - Raw Data Landing (8 min)
B.1.1 Navigate to Bronze Lakehouse
Navigation: 1. Browser Tab 2 (or navigate in Tab 1) 2. Click: Workspace > lh_bronze Lakehouse 3. Expand: Tables folder
[Screenshot: Lakehouse Explorer - Bronze Tables]
Source: Microsoft Fabric Lakehouse Overview
Talking Points:
"This is our Bronze layer - the landing zone for all raw data. Notice we have tables for each data domain: - Slot telemetry from the gaming floor - Player profiles from the loyalty system - Financial transactions from the cage - Compliance filings for regulatory reporting"
B.1.2 Explore Raw Data
Navigation: 1. Click: bronze_slot_telemetry table 2. Click: "Preview" button
Talking Points:
"Let's look at the raw slot data. This comes directly from the SAS protocol on the gaming machines.
Key things to notice: - We preserve the data exactly as received - no transformation yet - Every record has metadata: ingestion timestamp, batch ID, source file - This allows us to reprocess if business rules change
In a typical casino, we're ingesting millions of these events per day."
Navigation: 1. Click: bronze_player_profile table 2. Click: "Preview"
Talking Points:
"Here's our player data. Notice something important - we DON'T see raw SSN values here. Even at the Bronze layer, we hash PII on ingestion.
This is a compliance requirement - we never store unprotected social security numbers. The original value is hashed using SHA-256 before landing in the lakehouse."
B.1.3 Show Data Volume
Navigation: 1. Right-click bronze_slot_telemetry 2. Select: "View table details" or run quick SQL
SQL to run (if needed):
SELECT
    COUNT(*) as total_records,
    MIN(event_timestamp) as earliest_event,
    MAX(event_timestamp) as latest_event,
    COUNT(DISTINCT machine_id) as unique_machines
FROM bronze_slot_telemetry;
Talking Points:
"You can see we have [X] records spanning [Y] days of gaming activity across [Z] machines. This is realistic scale for a medium-sized casino floor."
Transition:
"Raw data isn't useful for analytics. Let's see how we transform it in the Silver layer."
B.2 Silver Layer - Data Quality & Cleansing (8 min)
B.2.1 Navigate to Silver Lakehouse
Navigation: 1. Click: Workspace breadcrumb 2. Click: lh_silver Lakehouse 3. Expand: Tables folder
[Screenshot: Lakehouse Explorer - Silver Tables]
Talking Points:
"The Silver layer is where we apply business logic. Notice the tables have different names - they're cleansed, validated versions of the raw data."
B.2.2 Execute Silver Transformation Notebook
Navigation: 1. Click: Workspace breadcrumb 2. Navigate to: Notebooks folder 3. Open: 01_silver_slot_cleansed
Talking Points:
"Let me show you a transformation notebook. This is PySpark running natively in Fabric."
Walk through the notebook (do NOT run live - show code):
Cell 1 - Configuration:
"First, we read from Bronze. No credentials needed - Fabric handles authentication automatically."
Cell 2 - Data Quality Rules:
"Here's where we apply business rules: - Remove records where machine_id is null - these are orphan events - Fix negative coin values - data quality issues from the source - Deduplicate based on machine, timestamp, and event type"
Cell 3 - Quality Score:
"We calculate a data quality score for each record. This lets us track data health over time and identify problematic sources."
[Screenshot: Notebook code showing quality rules]
B.2.3 Show Data Quality Improvements
Navigation: 1. Return to lh_silver Lakehouse 2. Open SQL endpoint 3. Run quality comparison query
SQL Query:
SELECT
    'Bronze' as layer,
    COUNT(*) as total_records,
    COUNT(CASE WHEN machine_id IS NULL THEN 1 END) as null_machines,
    COUNT(CASE WHEN coin_in < 0 THEN 1 END) as negative_values
FROM lh_bronze.bronze_slot_telemetry
UNION ALL
SELECT
    'Silver',
    COUNT(*),
    COUNT(CASE WHEN machine_id IS NULL THEN 1 END),
    COUNT(CASE WHEN coin_in < 0 THEN 1 END)
FROM lh_silver.silver_slot_cleansed;
Talking Points:
"Look at the difference. Bronze has [X] null machines and [Y] negative values. Silver has zero of both. The data is now validated and ready for analytics."
Transition:
"Clean data is great, but business users need metrics and KPIs. That's what the Gold layer provides."
B.3 Gold Layer - Business-Ready Analytics (9 min)
B.3.1 Navigate to Gold Lakehouse
Navigation: 1. Click: Workspace breadcrumb 2. Click: lh_gold Lakehouse 3. Expand: Tables folder
[Screenshot: Lakehouse Explorer - Gold Tables]
Talking Points:
"The Gold layer is optimized for business consumption. Notice these are aggregated tables: -
gold_slot_performance- machine-level KPIs by day -gold_player_360- complete player profiles with lifetime value -gold_compliance_reporting- regulatory filing summaries"
B.3.2 Execute Gold Aggregation Notebook
Navigation: 1. Navigate to Notebooks 2. Open: 01_gold_slot_performance
Walk through key sections:
KPI Calculations:
"Here we calculate casino-specific metrics: - Net Win = Coin In minus Coin Out - this is gross gaming revenue - Hold Percentage = Net Win divided by Coin In - the actual house edge - Theoretical Win = Expected win based on game math (typically 8%) - Hold Variance = Actual versus expected - this alerts us to problems"
Talking Points:
"If a machine's hold variance is significantly negative, it could indicate: - A malfunction paying out too much - Advantage play or fraud - Math model errors
These are the metrics that floor managers and regulators care about."
B.3.3 Show Business-Ready Data
Navigation: 1. Return to lh_gold Lakehouse 2. Click: gold_slot_performance 3. Preview the data
Talking Points:
"This is what your BI team consumes. Clean, aggregated, with all KPIs pre-calculated.
Notice it's partitioned by business_date - this optimizes query performance when slicing by time period, which is 90% of gaming analytics."
SQL Query (optional):
SELECT
    business_date,
    SUM(total_coin_in) as total_coin_in,
    SUM(net_win) as total_net_win,
    AVG(actual_hold_pct) as avg_hold_pct
FROM gold_slot_performance
GROUP BY business_date
ORDER BY business_date DESC
LIMIT 7;
"Here's a week of gaming revenue at a glance. This query runs in under a second against millions of records."
Transition:
"So far, we've seen batch processing. But casinos need real-time visibility into their floor. Let me show you Real-Time Intelligence."
C. Real-Time Intelligence Demo (20 min)
Objective: Demonstrate live streaming analytics with Eventhouse and KQL.
C.1 Eventhouse Setup Overview (5 min)
C.1.1 Navigate to Eventhouse
Navigation: 1. Click: Workspace breadcrumb 2. Click: eh_casino_realtime Eventhouse 3. Click: casino_floor_monitoring database
[Screenshot: Eventhouse with KQL Database]
Talking Points:
"Real-Time Intelligence in Fabric is built on the same engine as Azure Data Explorer - incredibly fast for time-series data.
This Eventhouse receives streaming events from the casino floor. Data arrives within seconds of a slot pull or jackpot hit."
C.1.2 Show Eventstream Configuration
Navigation: 1. Click: Workspace breadcrumb 2. Navigate to: es_slot_telemetry Eventstream 3. Show the data flow diagram
[Screenshot: Eventstream visual designer]
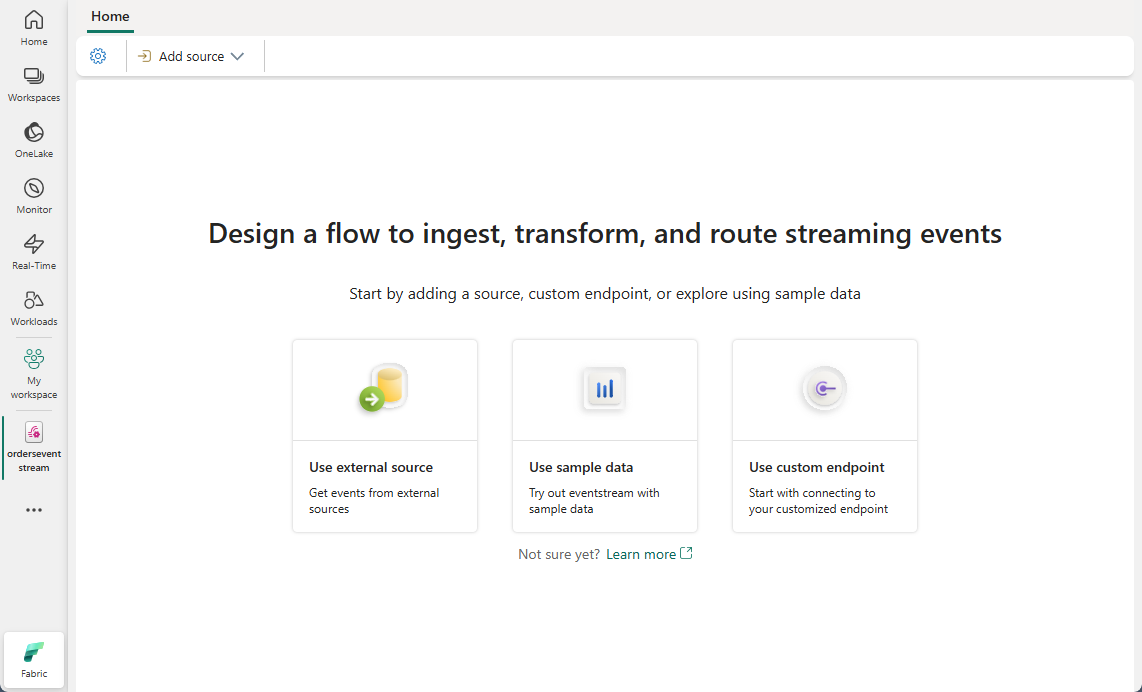
Source: Create an Eventstream in Microsoft Fabric
Talking Points:
"Here's how data flows in: - Source: Event Hub receiving slot machine events (could also be IoT Hub, Kafka, custom app) - Transformations: Parse JSON, add timestamp - Destination: Our KQL database
This is no-code ingestion - configured entirely through the visual designer."
C.2 Start Streaming Producer (if not already running)
Navigation: 1. Open terminal/command prompt (can be hidden if pre-started) 2. Verify producer is running
Talking Points:
"In a real casino, the slot management system pushes events continuously. For this demo, we have a simulator generating realistic telemetry."
Note: If starting the producer live:
C.3 Live Data in KQL (10 min)
C.3.1 Navigate to KQL Query Editor
Navigation: 1. Return to Eventhouse 2. Click: "Explore your data" or open KQL Queryset
[Screenshot: KQL Query Editor]
C.3.2 Real-Time Floor Summary
Run KQL Query:
// Current floor activity (last 5 minutes)
SlotEvents
| where event_timestamp > ago(5m)
| summarize
    active_machines = dcount(machine_id),
    total_coin_in = sum(coin_in),
    total_games = sum(games_played),
    jackpots = countif(event_type == "JACKPOT")
by zone
| order by total_coin_in desc
Talking Points:
"This shows real-time activity across the casino floor. In the last 5 minutes: - [X] active machines across [Y] zones - $[Z] in coin-in (wagers) - [N] jackpots hit
A floor manager can see at a glance which zones are hot."
C.3.3 Machine Anomaly Detection
Run KQL Query:
// Machines with unusual hold (last hour)
SlotEvents
| where event_timestamp > ago(1h)
| summarize
    coin_in = sum(coin_in),
    coin_out = sum(coin_out)
by machine_id, zone
| extend
    net_win = coin_in - coin_out,
    hold_pct = (coin_in - coin_out) / coin_in * 100
| where hold_pct < 2 or hold_pct > 15
| project machine_id, zone, coin_in, net_win, hold_pct
| order by hold_pct asc
Talking Points:
"Here's where it gets interesting for operations. We're looking for machines outside normal parameters: - Hold below 2% - machine might be malfunctioning or being exploited - Hold above 15% - could indicate a stuck mechanism or player disputes
These alerts would typically trigger a floor check or technician dispatch."
C.3.4 Jackpot Tracking
Run KQL Query:
// Recent jackpots
SlotEvents
| where event_type == "JACKPOT"
| where event_timestamp > ago(1h)
| project
    event_timestamp,
    machine_id,
    zone,
    jackpot_amount,
    player_id
| order by event_timestamp desc
| take 10
Talking Points:
"Every jackpot is tracked in real-time. For hand-pays over $1,200, we need to generate W-2G tax forms. This data feeds directly into our compliance reporting."
C.4 Real-Time Dashboard Updates (5 min)
C.4.1 Navigate to Real-Time Dashboard
Navigation: 1. Click: Workspace breadcrumb 2. Navigate to: Casino Floor Monitor dashboard
[Screenshot: Real-Time Dashboard with multiple tiles]
Talking Points:
"This dashboard auto-refreshes every 30 seconds. Let's watch the numbers change..."
Wait for refresh to show updated values
"There - you can see the coin-in numbers just updated. This is the same view your floor managers would have on monitors throughout the casino."
C.4.2 Highlight Key Tiles
Walk through dashboard tiles:
| Tile | What to Point Out |
|---|---|
| Active Machines | "Shows machines currently in play" |
| Zone Activity Chart | "Heatmap of where the action is" |
| Jackpot Feed | "Every jackpot as it happens" |
| Alert Panel | "Automated anomaly detection" |
Talking Points:
"Notice the alert panel - it's automatically flagging: - Hot machines (unusually high hold) - Big jackpots requiring floor attention - Silent machines that stopped reporting
This is proactive operations - problems are surfaced before customers complain."
Transition:
"Real-time is critical for operations, but executives and analysts need historical trends and deep analysis. Let me show you our Power BI integration."
D. Power BI & Direct Lake Demo (20 min)
Objective: Demonstrate sub-second analytics with Direct Lake and interactive dashboards.
D.1 Open Semantic Model (5 min)
D.1.1 Navigate to Semantic Model
Navigation: 1. Click: Workspace breadcrumb 2. Click: Casino Analytics Model semantic model 3. Show model view
[Screenshot: Semantic Model in diagram view]
Talking Points:
"This is our Direct Lake semantic model. A few important things:
- Storage mode is Direct Lake - data is read directly from Delta tables in OneLake
- No scheduled refresh needed - when Gold layer updates, reports see it immediately
- Sub-second queries - the Fabric engine optimizes for BI workloads"
D.1.2 Show Direct Lake Connection
Navigation: 1. Click: Model settings (gear icon) 2. Show storage mode setting

Source: Direct Lake Overview
Talking Points:
"See here - Storage mode: Direct Lake. This is different from: - Import mode (copies data into Power BI) - DirectQuery (queries source on every interaction)
Direct Lake gives you import-mode performance with DirectQuery-style freshness. Best of both worlds."
D.2 Navigate Executive Dashboard (8 min)
D.2.1 Open Power BI Report
Navigation: 1. Browser Tab 4 (Power BI) 2. Or navigate: Workspace > Executive Dashboard report
[Screenshot: Executive Dashboard full view]
Talking Points:
"Here's what the casino GM sees every morning. One screen, all key metrics."
D.2.2 Walk Through KPI Cards
Point to each card:
| Card | Talking Point |
|---|---|
| Net Win | "Total gaming revenue - this is the number that matters most" |
| Hold % | "Actual house edge - should be around 8% for slots" |
| Active Players | "Unique players with tracked activity" |
| Games Played | "Transaction volume - health indicator" |
Talking Points:
"These are live numbers from Gold layer. If a notebook runs and updates Gold tables, these cards reflect it within minutes."
D.2.3 Show Net Win Trend
Click on the trend line chart
Talking Points:
"This trend shows daily net win with comparison to prior period. Notice: - Weekends peak (Friday-Saturday) - Slight dip mid-week - This is typical casino seasonality
The dotted line shows prior month for context."
D.2.4 Zone Performance Bar Chart
Hover over zones
Talking Points:
"Here's performance by zone. VIP zone generates disproportionate revenue - that's expected given higher limits.
But notice Penny Palace - high volume, lower revenue per transaction. Different player profile."
D.3 Drill-Through Examples (4 min)
D.3.1 Drill from Zone to Machines
Navigation: 1. Right-click on a zone bar 2. Select: Drill through > Machine Details
Talking Points:
"Let's drill into the VIP zone... Here are the individual machines, ranked by net win.
This helps identify: - Top performers to protect - Underperformers that might need different placement or removal"
D.3.2 Show Cross-Filtering
Navigation: 1. Click on a date in the trend chart 2. Show how other visuals filter
Talking Points:
"Power BI cross-filtering in action. Click one date, everything else filters. Want to see what happened on New Year's Eve? One click."
D.4 Q&A Visual Demo (3 min)
D.4.1 Navigate to Q&A Page (if available)
Navigation: 1. Navigate to Q&A visual or page 2. Or add Q&A visual to demo
Type natural language query:
Talking Points:
"Power BI natural language query - ask business questions in plain English.
'Show me net win by zone for last week'
The model understands casino terminology because we defined glossary terms and proper measure names."
Try another query:
Talking Points:
"This is how you democratize analytics. Business users don't need to know DAX or SQL - they just ask questions."
Transition:
"Beautiful dashboards are great, but in regulated industries, you need to prove data integrity and lineage. Let me show you Purview."
E. Governance with Purview Demo (15 min)
Objective: Demonstrate data governance, lineage, and compliance capabilities.
E.1 Data Catalog Search (4 min)
E.1.1 Navigate to Purview Portal
Navigation: 1. Browser Tab 5 (Purview Portal) 2. Or navigate to: purview.microsoft.com
[Screenshot: Purview Portal home]

Source: Microsoft Purview Governance Portal
Talking Points:
"Microsoft Purview is our governance hub. Think of it as the 'Google for your data' - catalog everything, track lineage, enforce policies."
E.1.2 Search for Casino Data
Navigation: 1. Click: Data Catalog (or search bar) 2. Search: "slot"
[Screenshot: Search results showing slot-related assets]
Talking Points:
"Search for 'slot' and we find all assets related to slot machines: - Bronze raw tables - Silver cleansed tables - Gold aggregations - Even the Power BI reports
Everything is automatically cataloged when we scan Fabric."
E.1.3 Show Asset Details
Navigation: 1. Click on gold_slot_performance in results 2. Show asset detail page
Talking Points:
"Each asset has: - Schema with column descriptions - Classifications (auto-detected PII, financial data) - Ownership and stewardship - Related glossary terms"
E.2 Lineage Visualization (5 min)
E.2.1 Navigate to Lineage View
Navigation: 1. On asset page, click: "Lineage" tab 2. Show end-to-end data flow
[Screenshot: Lineage diagram showing Bronze -> Silver -> Gold -> Power BI]
Talking Points:
"This is the killer feature for compliance. Complete lineage from source to report.
Follow the path: 1. bronze_slot_telemetry - raw data lands here 2. Notebook transformation - cleansing logic 3. silver_slot_cleansed - validated data 4. Another notebook - aggregation 5. gold_slot_performance - business metrics 6. Casino Analytics Model - semantic layer 7. Executive Dashboard - final report
When a regulator asks 'where did this number come from?' - one click shows the complete journey."
E.2.2 Impact Analysis
Navigation: 1. Click on a source table 2. Show downstream dependencies
Talking Points:
"Now the power move - impact analysis. Click on Bronze table and see: - What Silver tables depend on it? - What Gold tables? - Which reports?
If you need to change a source schema, you know exactly what breaks downstream."
E.3 Sensitivity Labels (3 min)
E.3.1 Show Classifications
Navigation: 1. Navigate to silver_player_master asset 2. Show column classifications
[Screenshot: Asset showing PII classifications]
Talking Points:
"Purview automatically classifies sensitive data: - email - classified as Email Address - phone - classified as Phone Number - date_of_birth - Date of Birth - ssn_hash - Government ID (hashed)
These classifications drive downstream policies - who can see what."
E.3.2 Data Protection Policies
Talking Points:
"With sensitivity labels, you can enforce: - Row-level security based on user role - Column masking for PII - Export restrictions for highly confidential data
This is how you prove to regulators that you're protecting player data."
E.4 Glossary Terms (3 min)
E.4.1 Navigate to Glossary
Navigation: 1. Click: Data catalog > Glossary 2. Navigate to: Casino Operations hierarchy
[Screenshot: Business glossary with casino terms]
Talking Points:
"The business glossary ensures everyone speaks the same language. Look at our casino metrics:
Coin In - Total amount wagered by players Hold Percentage - Actual house edge Theoretical Win - Expected win based on game math
These definitions link to actual data columns. When a BI developer sees 'hold_pct', they click through to see the official definition."
E.4.2 Show Term Linked to Asset
Navigation: 1. Click on "Net Win" glossary term 2. Show linked assets
Talking Points:
"The glossary term 'Net Win' is linked to: - The gold table column - The DAX measure - Related documentation
No more confusion about what metrics mean."
Transition:
"That concludes the main demo. Let me summarize what we've seen and open it up for questions."
F. Wrap-up & Q&A (5 min)
Objective: Reinforce key messages, provide next steps, facilitate questions.
F.1 Summary of Capabilities (2 min)
Return to workspace overview or architecture slide
Talking Points:
"In 85 minutes, we've seen a complete modern data platform:
1. Medallion Architecture - Bronze for raw data with full auditability - Silver for data quality and validation - Gold for business-ready analytics
2. Real-Time Intelligence - Sub-second streaming from the casino floor - KQL for operational monitoring - Auto-refreshing dashboards
3. Direct Lake Power BI - No-refresh business intelligence - Interactive drill-through - Natural language Q&A
4. Purview Governance - Complete data lineage - Automatic PII classification - Business glossary
All in ONE platform. No data movement. Unified security."
F.2 Next Steps Discussion (2 min)
Talking Points:
"Where do we go from here?
Immediate next steps: - Connect your actual data sources - Customize the notebooks for your business rules - Train your team on the tutorials we provide
This repository includes: - 9 step-by-step tutorials - Sample data generators - Infrastructure-as-Code for deployment - Full documentation
The code is yours - fork it, customize it, run with it."
F.3 Resource Links (30 sec)
Show or verbally provide:
| Resource | Link |
|---|---|
| GitHub Repository | github.com/fgarofalo56/Suppercharge_Microsoft_Fabric |
| Microsoft Fabric Docs | learn.microsoft.com/fabric |
| Purview Documentation | learn.microsoft.com/purview |
| Support Contact | [Your contact info] |
F.4 Q&A (remaining time)
Talking Points:
"I'm happy to take questions. What would you like to dive deeper into?"
Common questions to anticipate:
| Question | Short Answer |
|---|---|
| "What's the cost?" | "F64 is approximately $X/month. We can do a detailed cost analysis based on your data volumes." |
| "How long to deploy?" | "Infrastructure deploys in ~1 hour. Full data pipeline with your data: 2-3 weeks typical." |
| "Can this handle our scale?" | "Fabric scales to petabytes. We'd need to size capacity based on your specific requirements." |
| "What about compliance?" | "We've built in patterns for NIGC MICS, FinCEN CTR/SAR, W-2G. Customizable for your jurisdiction." |
| "How does this compare to other data platforms?" | "Fabric's emphasis is tight integration of compute, storage, BI, and governance in one SaaS platform, which can reduce data movement. Competing platforms have their own strengths — recommend evaluating against your specific requirements and each vendor's current documentation." |
🔧 4. Troubleshooting Quick Reference
| Symptom | Cause | Fix |
|---|---|---|
| Lakehouse shows "Loading..." forever | Capacity paused or no access | Resume capacity in Azure portal; verify workspace permissions |
| Notebook won't execute | Session timeout or capacity issue | Click "Stop session" then restart; check capacity status |
| KQL queries return empty | Streaming producer stopped | Restart producer script; check Eventstream status |
| Power BI report blank | Semantic model refresh needed | Open semantic model, click Refresh (only for non-Direct Lake) |
| Purview shows no assets | Scan not run or failed | Re-run scan; check Fabric connection in Purview |
| "Access Denied" errors | Permission issue | Verify user has Contributor role on workspace |
| Slow query performance | Insufficient capacity | Check CU utilization; consider scaling up |
| Eventstream stuck "Pending" | Configuration error | Delete and recreate; verify source credentials |
| Dashboard not refreshing | Auto-refresh disabled | Enable in dashboard settings (30 sec minimum) |
| Cross-workspace access fails | OneLake shortcuts not configured | Set up shortcuts in Lakehouse settings |
🔀 5. Backup Demo Paths
5.1 If Bronze Lakehouse Not Available
Alternative: Show Architecture + Screenshots
- Display architecture diagram from
docs/ARCHITECTURE.md - Walk through Bronze layer concepts verbally
- Show sample data files in
sample-data/folder
Talking Points:
"While we work on the environment issue, let me show you what the Bronze layer contains conceptually..."
5.2 If Real-Time Streaming Not Working
Alternative: Historical KQL Demo
- Navigate to Eventhouse
- Run queries against historical data (remove time filters)
Modified Query:
// Use historical data instead of real-time
SlotEvents
| take 1000
| summarize
    active_machines = dcount(machine_id),
    total_coin_in = sum(coin_in)
by zone
Talking Points:
"Normally this would show live data. Let me show you the same patterns against our historical dataset..."
5.3 If Power BI Not Loading
Alternative: PDF Export + DAX Discussion
- Open pre-exported PDF of dashboards
- Walk through DAX measures in semantic model
Pre-export these reports: - Executive Dashboard (full) - Slot Operations Report - Player Analytics Report
Talking Points:
"While Power BI initializes, let me walk you through the report design using this export..."
5.4 If Purview Not Accessible
Alternative: Use Mermaid Lineage Diagram
- Open
docs/ARCHITECTURE.md - Show lineage section with Mermaid diagram
Talking Points:
"Purview provides this visually in an interactive way. Here's the same lineage concept in a diagram..."
5.5 Shortened Demo (45 minutes)
If time is cut, prioritize:
| Priority | Section | Time |
|---|---|---|
| 1 | Opening + Architecture | 3 min |
| 2 | Gold Layer + KPIs | 8 min |
| 3 | Real-Time Dashboard (pre-built) | 10 min |
| 4 | Power BI Executive Dashboard | 12 min |
| 5 | Purview Lineage (quick) | 7 min |
| 6 | Wrap-up | 5 min |
| Total | 45 min |
Skip: - Bronze/Silver detailed walkthrough - Notebook execution - KQL query writing - Q&A visual demo
📎 6. Appendix
6.1 Key URLs
| Resource | URL |
|---|---|
| Microsoft Fabric Portal | https://app.fabric.microsoft.com |
| Power BI Service | https://app.powerbi.com |
| Microsoft Purview | https://purview.microsoft.com |
| Azure Portal | https://portal.azure.com |
| GitHub Repository | https://github.com/fgarofalo56/Suppercharge_Microsoft_Fabric |
| Fabric Documentation | https://learn.microsoft.com/fabric |
6.2 Login Credentials Reference
SECURITY NOTE: Never include actual credentials in documentation. Use placeholders and a secure credential manager.
| System | Credential Location |
|---|---|
| Azure/Fabric | Microsoft Entra ID - use corporate SSO |
| Purview | Same Microsoft Entra ID account |
| SQL endpoints | Managed by Fabric - no separate creds |
| Event Hub (if used) | Azure Key Vault: kv-casino-poc/eventhub-connection |
Demo Account (if applicable):
6.3 Emergency Contacts
| Role | Name | Phone | |
|---|---|---|---|
| POC Lead | [Enter name] | [Enter phone] | [Enter email] |
| Microsoft CSA | [Enter name] | [Enter phone] | [Enter email] |
| IT Support | [Enter name] | [Enter phone] | [Enter email] |
| Backup Presenter | [Enter name] | [Enter phone] | [Enter email] |
6.4 Quick KQL Reference (for ad-hoc queries)
// Last N events
SlotEvents | take 100

// Filter by time
SlotEvents | where event_timestamp > ago(5m)

// Aggregate
SlotEvents | summarize count() by zone

// Join
SlotEvents
| join kind=inner (PlayerProfiles) on player_id

// Render visualization
SlotEvents | summarize count() by bin(event_timestamp, 1h) | render timechart
6.5 Quick DAX Reference (for ad-hoc measures)
// Basic sum
Total Coin In = SUM(gold_slot_performance[total_coin_in])

// Division with error handling
Hold % = DIVIDE([Net Win], [Total Coin In], 0) * 100

// Time intelligence
Coin In MTD = TOTALMTD([Total Coin In], dim_date[date_key])

// Conditional count
VIP Players = CALCULATE(COUNTROWS(gold_player_360), gold_player_360[tier] = "VIP")
6.6 Demo Feedback Form Link
After the demo, share this link for feedback:
[INSERT FEEDBACK FORM URL]
📜 Version History
| Version | Date | Author | Changes |
|---|---|---|---|
| 1.0.0 | 2025-01-21 | Frank Garofalo | Initial release |
📖 Related Documents
| Document | Description |
|---|---|
| POC Agenda | 3-day workshop overview |
| Instructor Guide | Full facilitator preparation guide |
| Diagram Guide | Mermaid diagram reference |
| Day 1: Medallion Foundation | Day 1 detailed guide |
Good luck with your demo!
Remember: The best demos tell a story. Guide the audience through the data journey from raw events to executive insights.